Visualisations, Data Sources and Data Sets
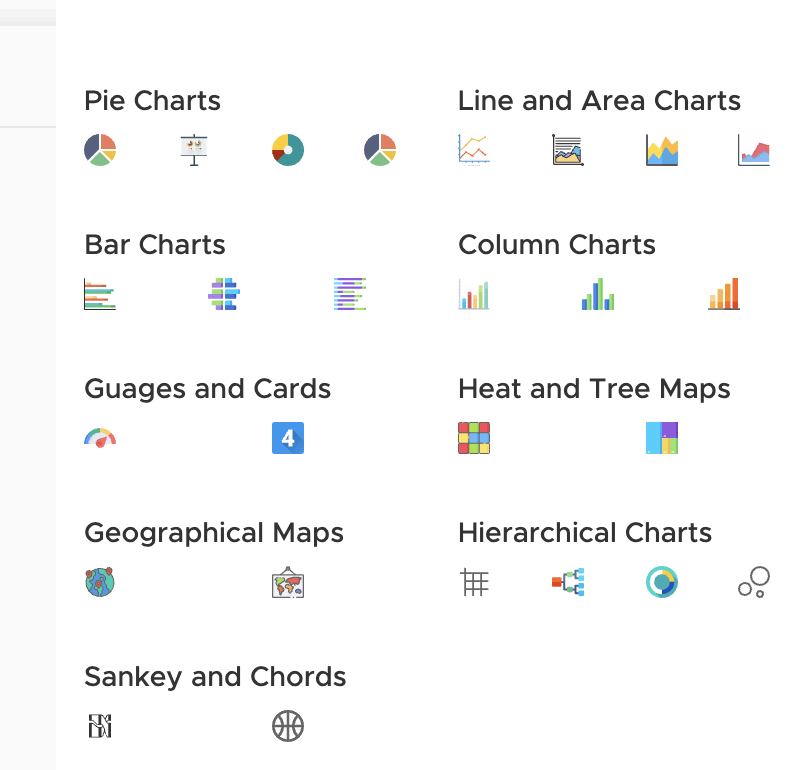
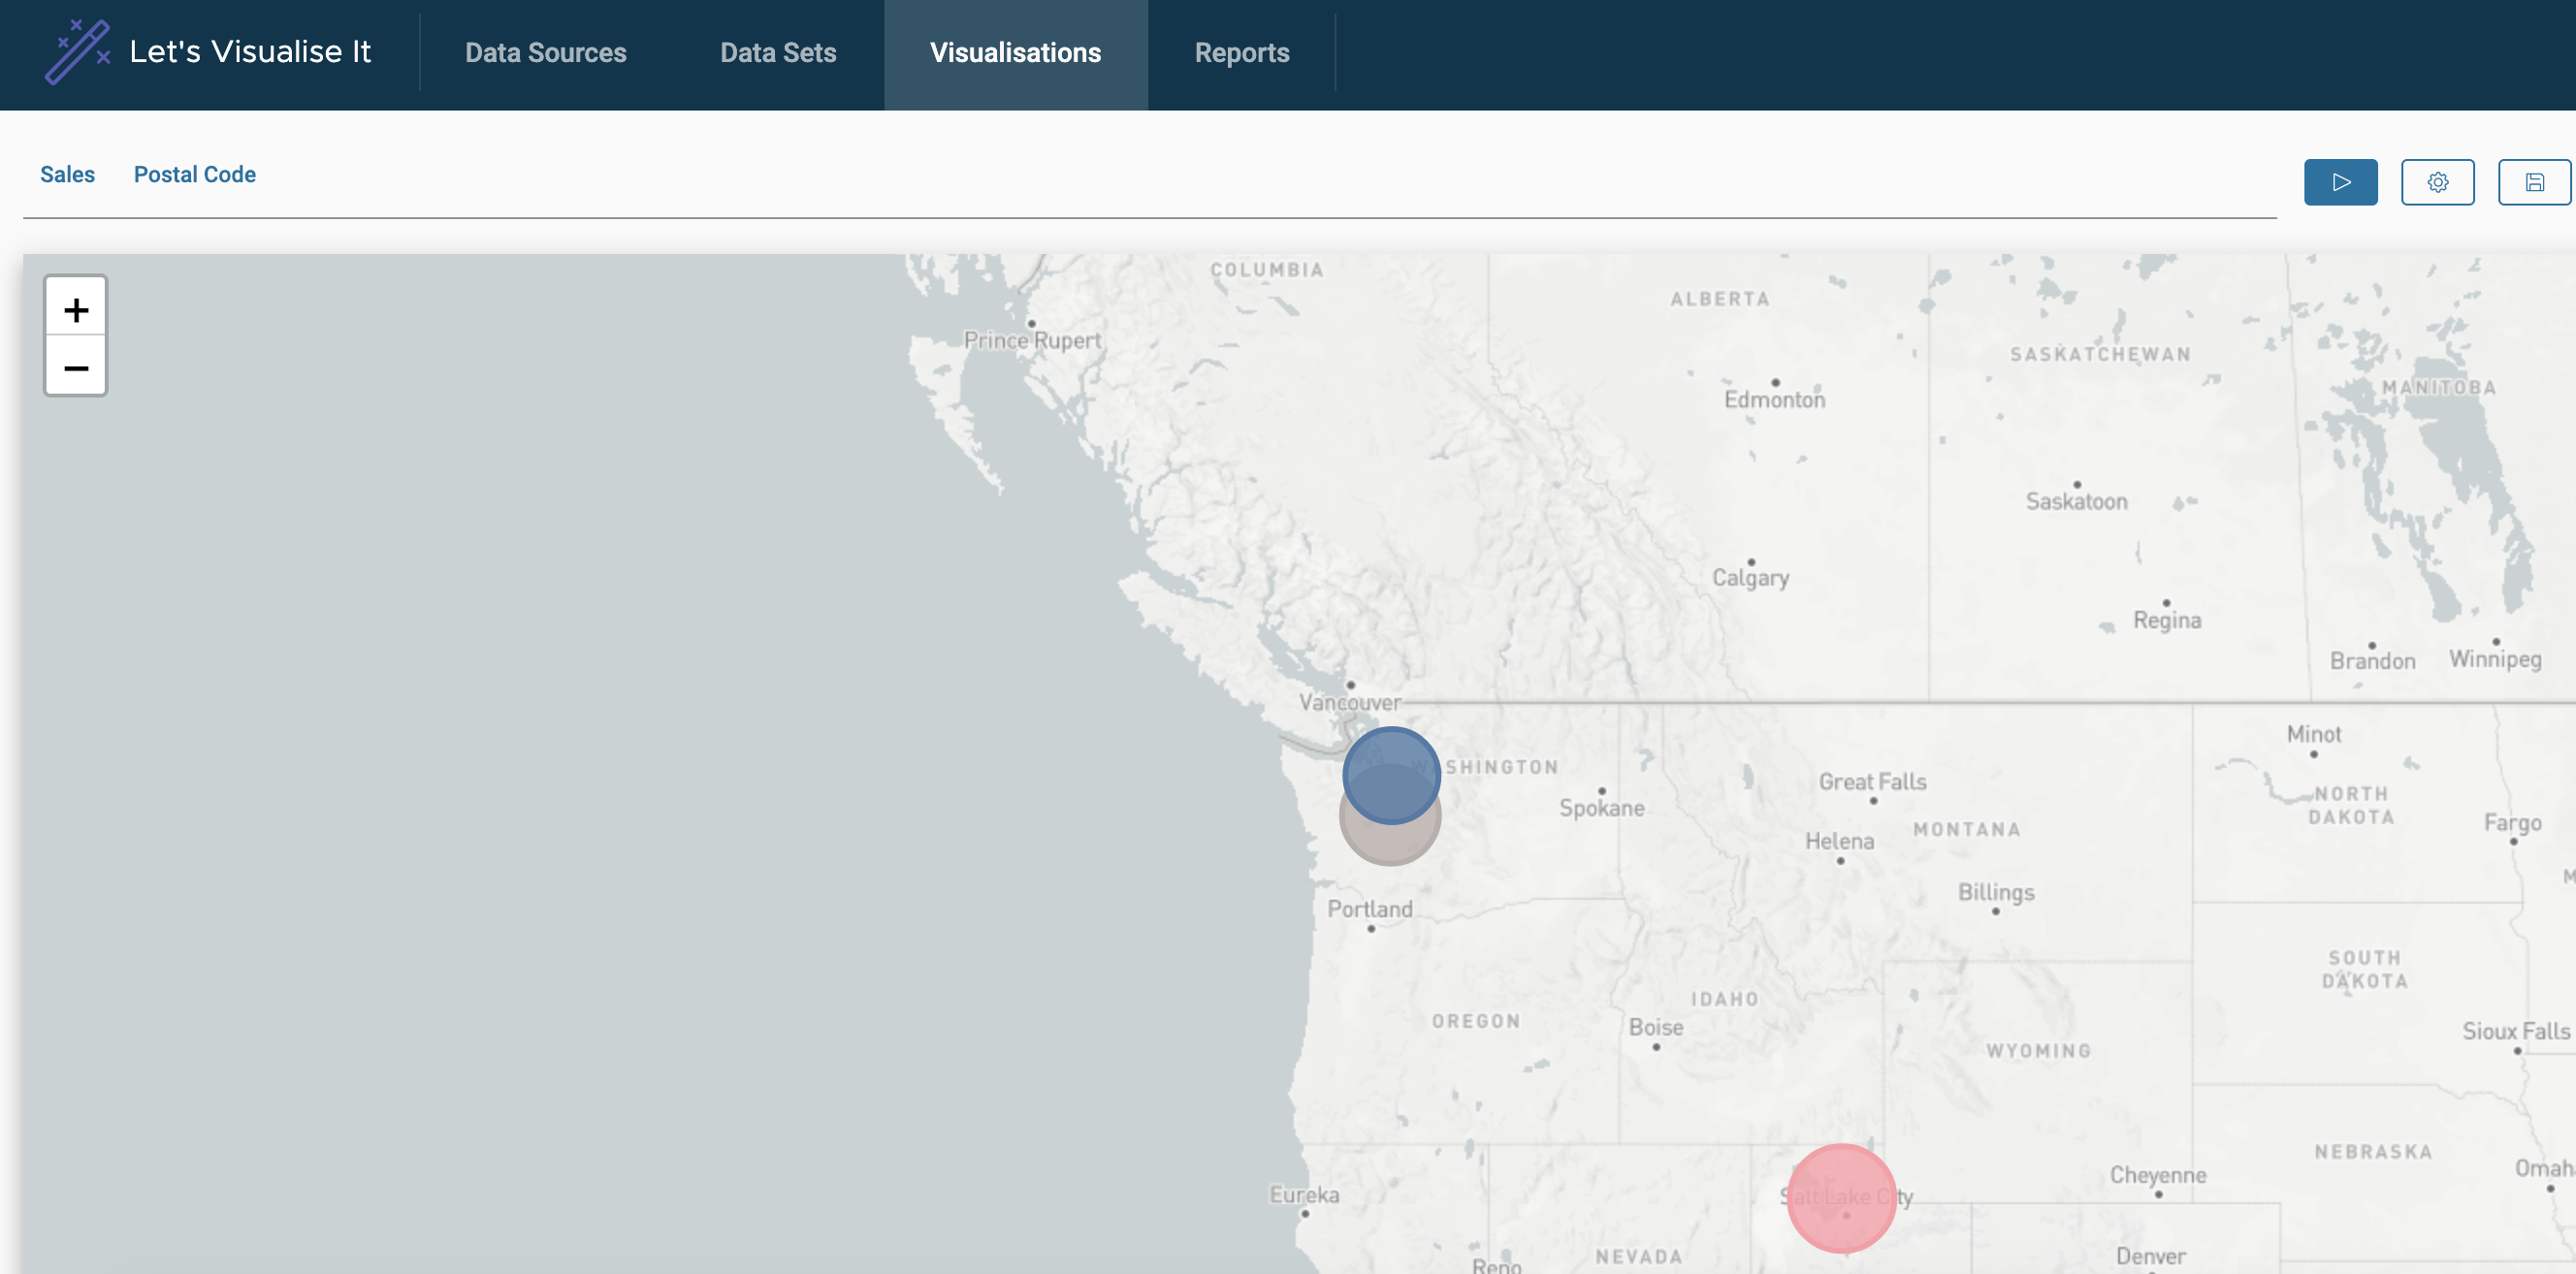
Pies, Bars, Maps, Sankey Diagrams, Big Query, SQL, CSV
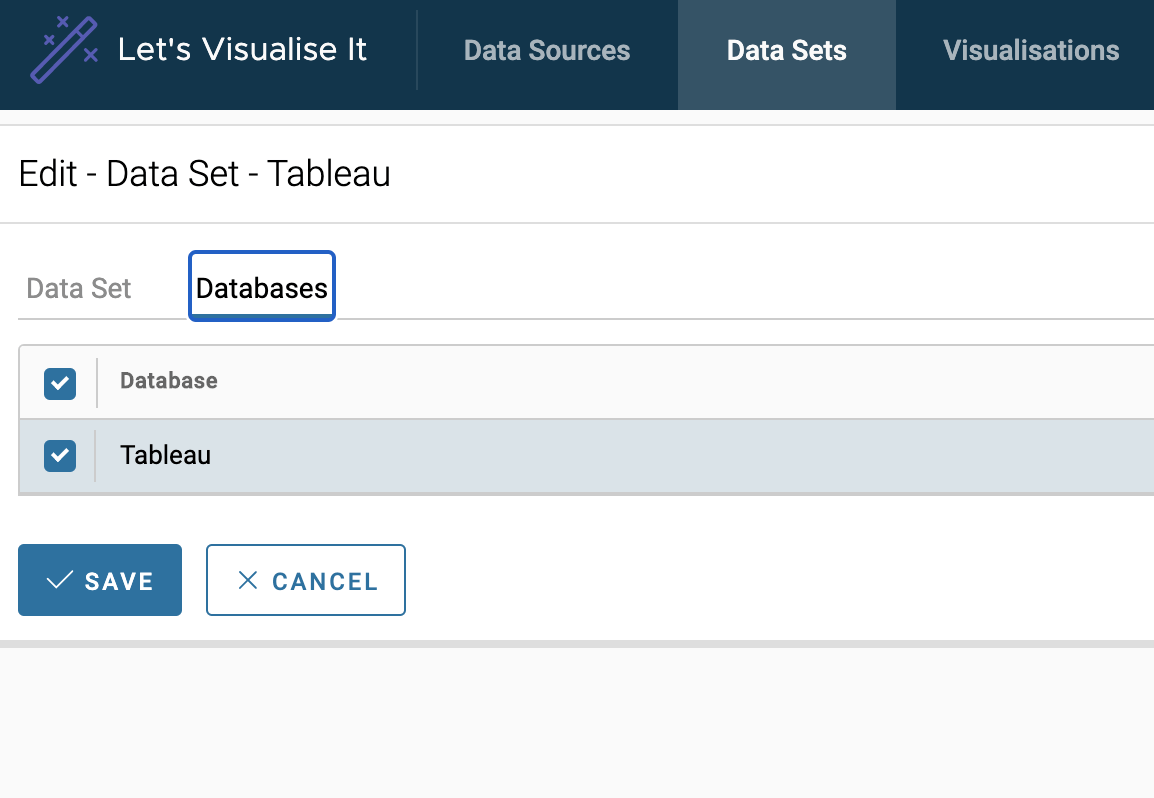
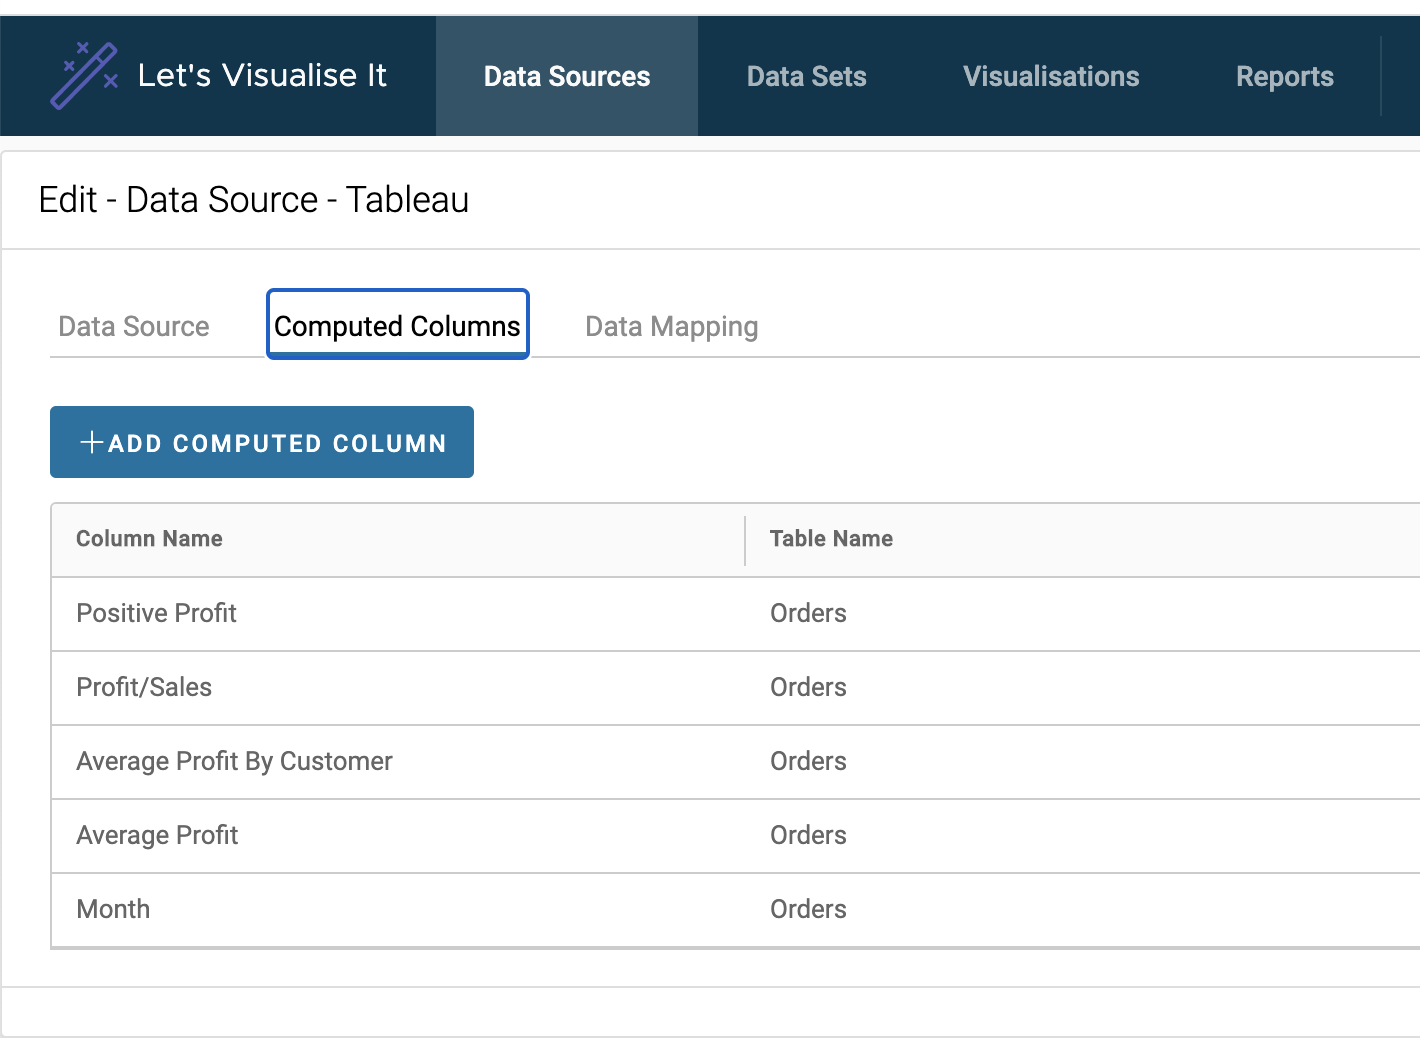
Combine multiple different data sources from CSV to Big Query in one single data set to view aggregated data.
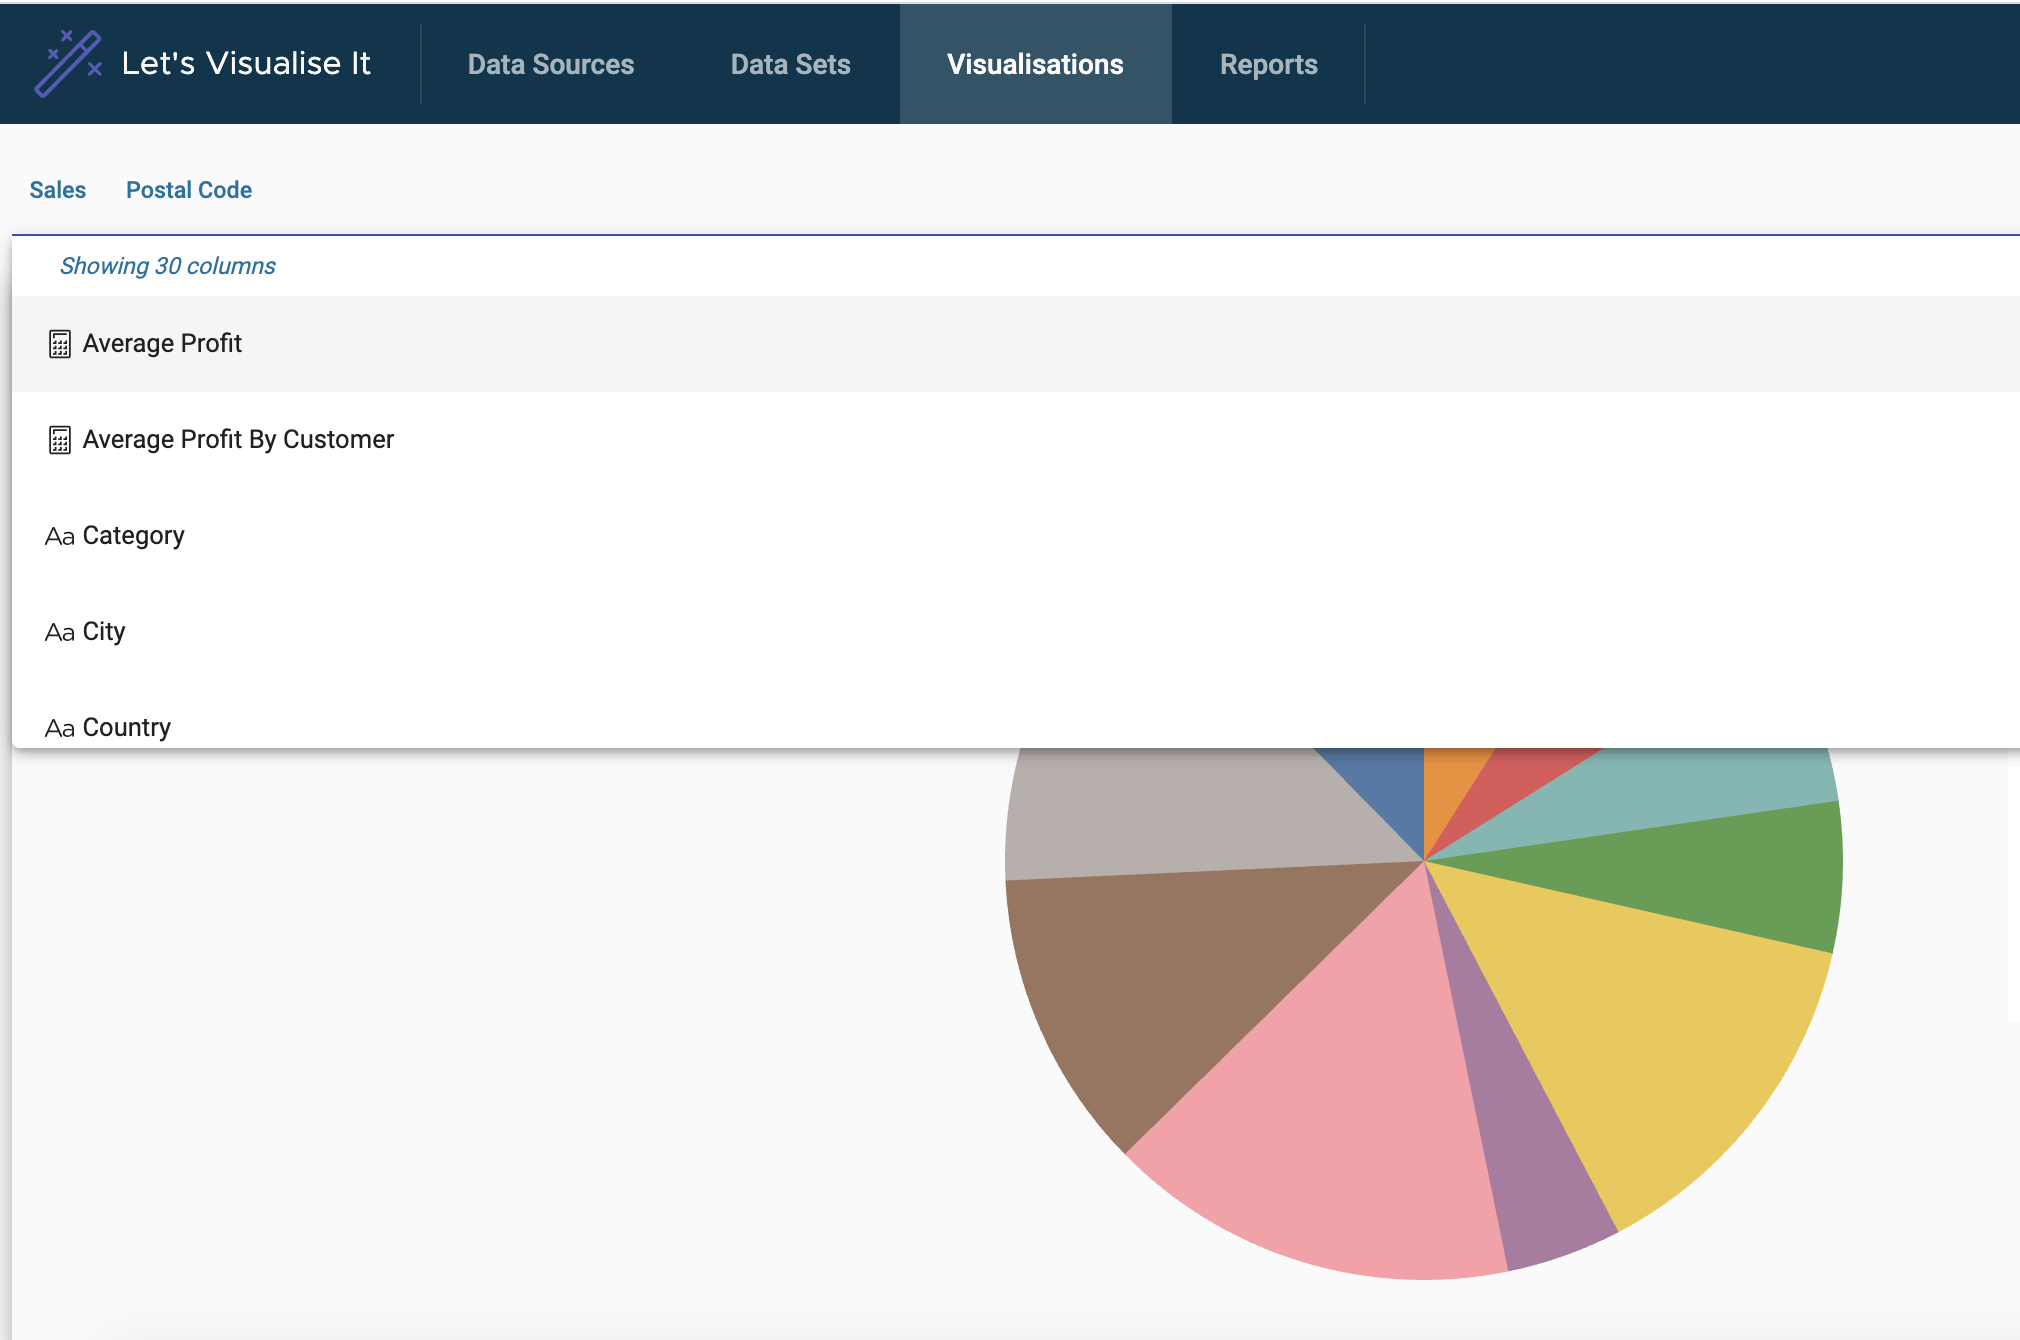
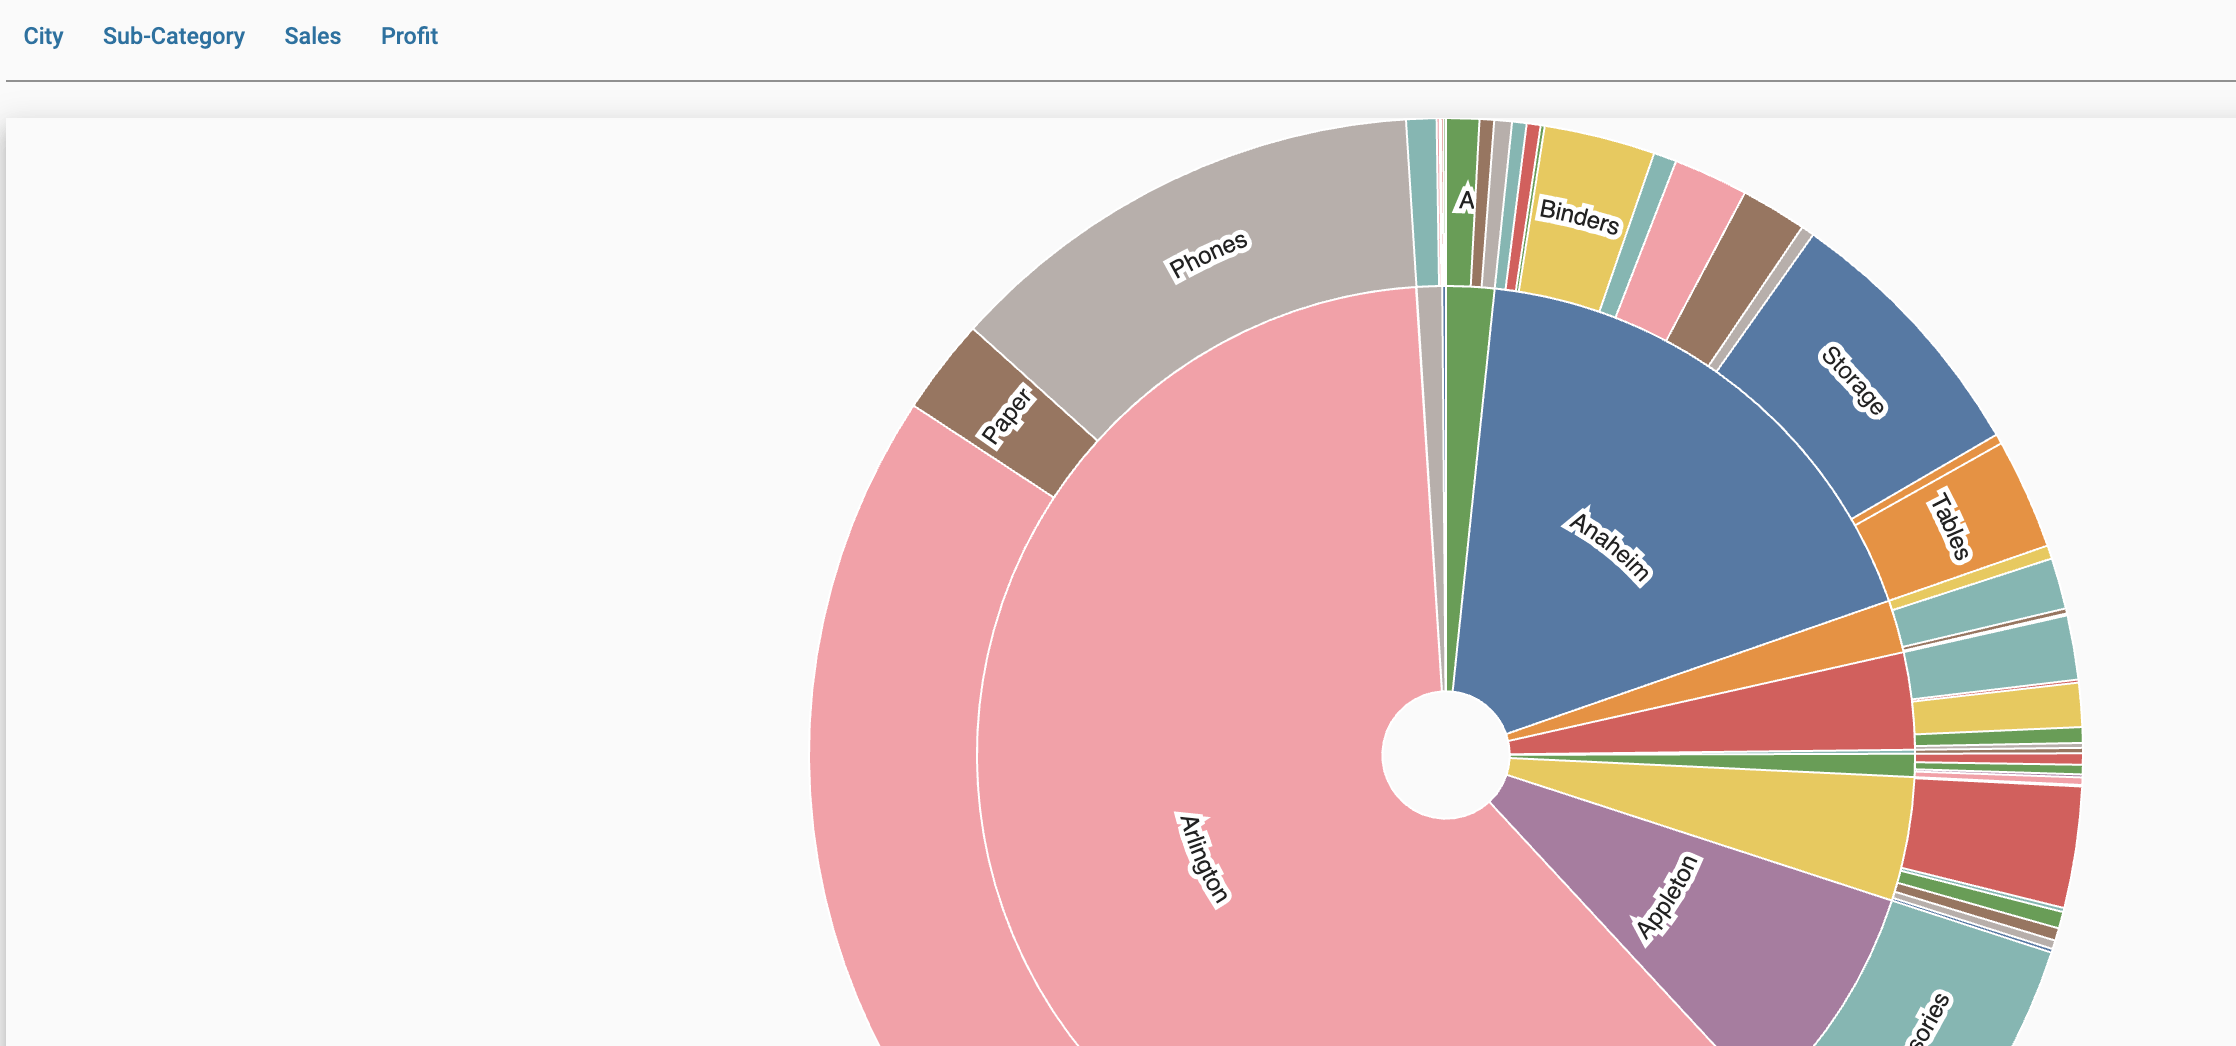
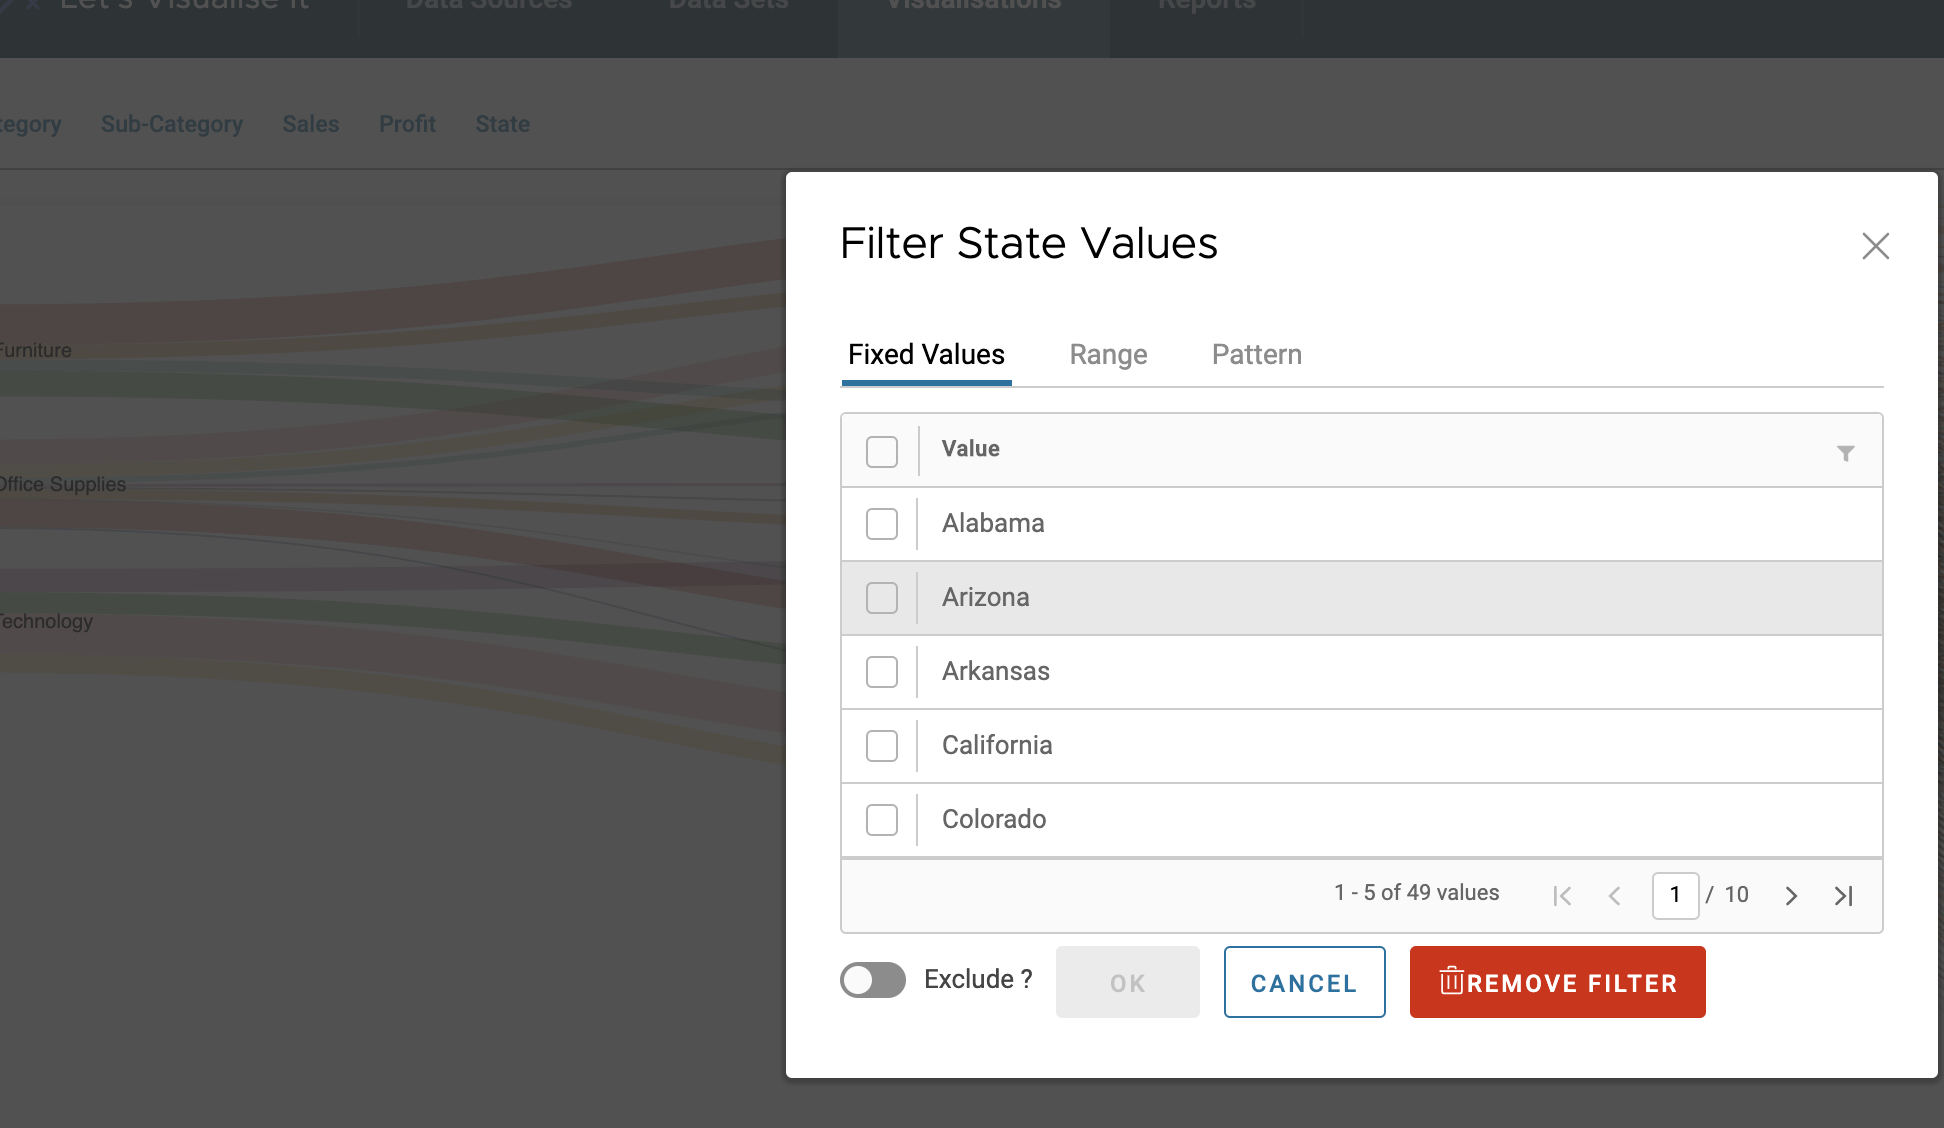
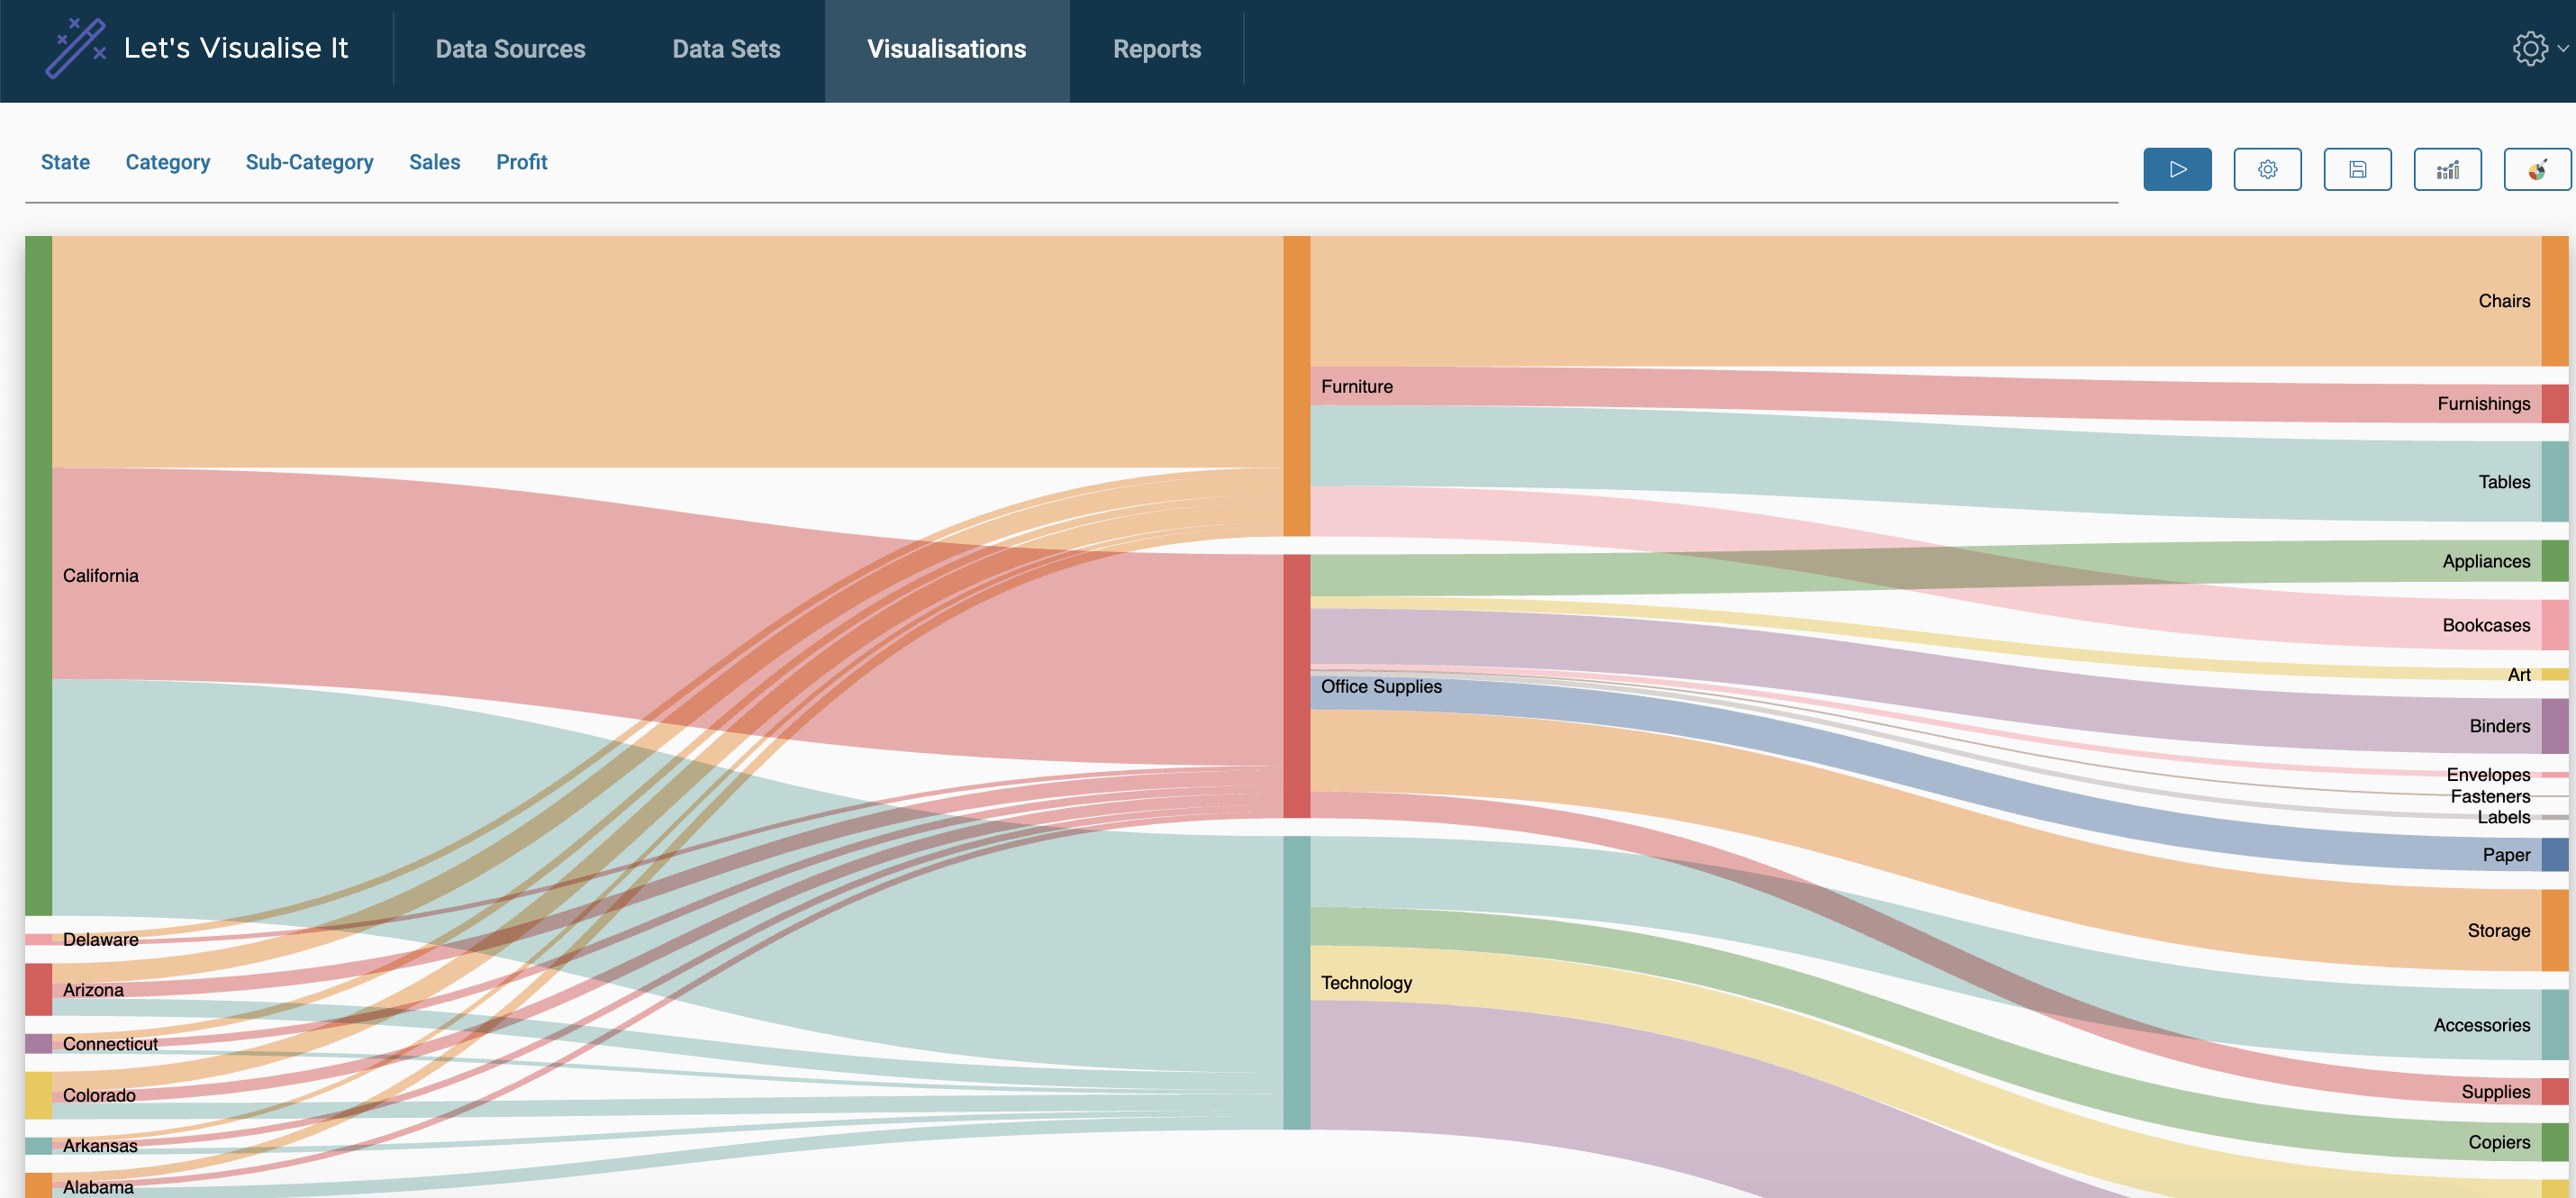
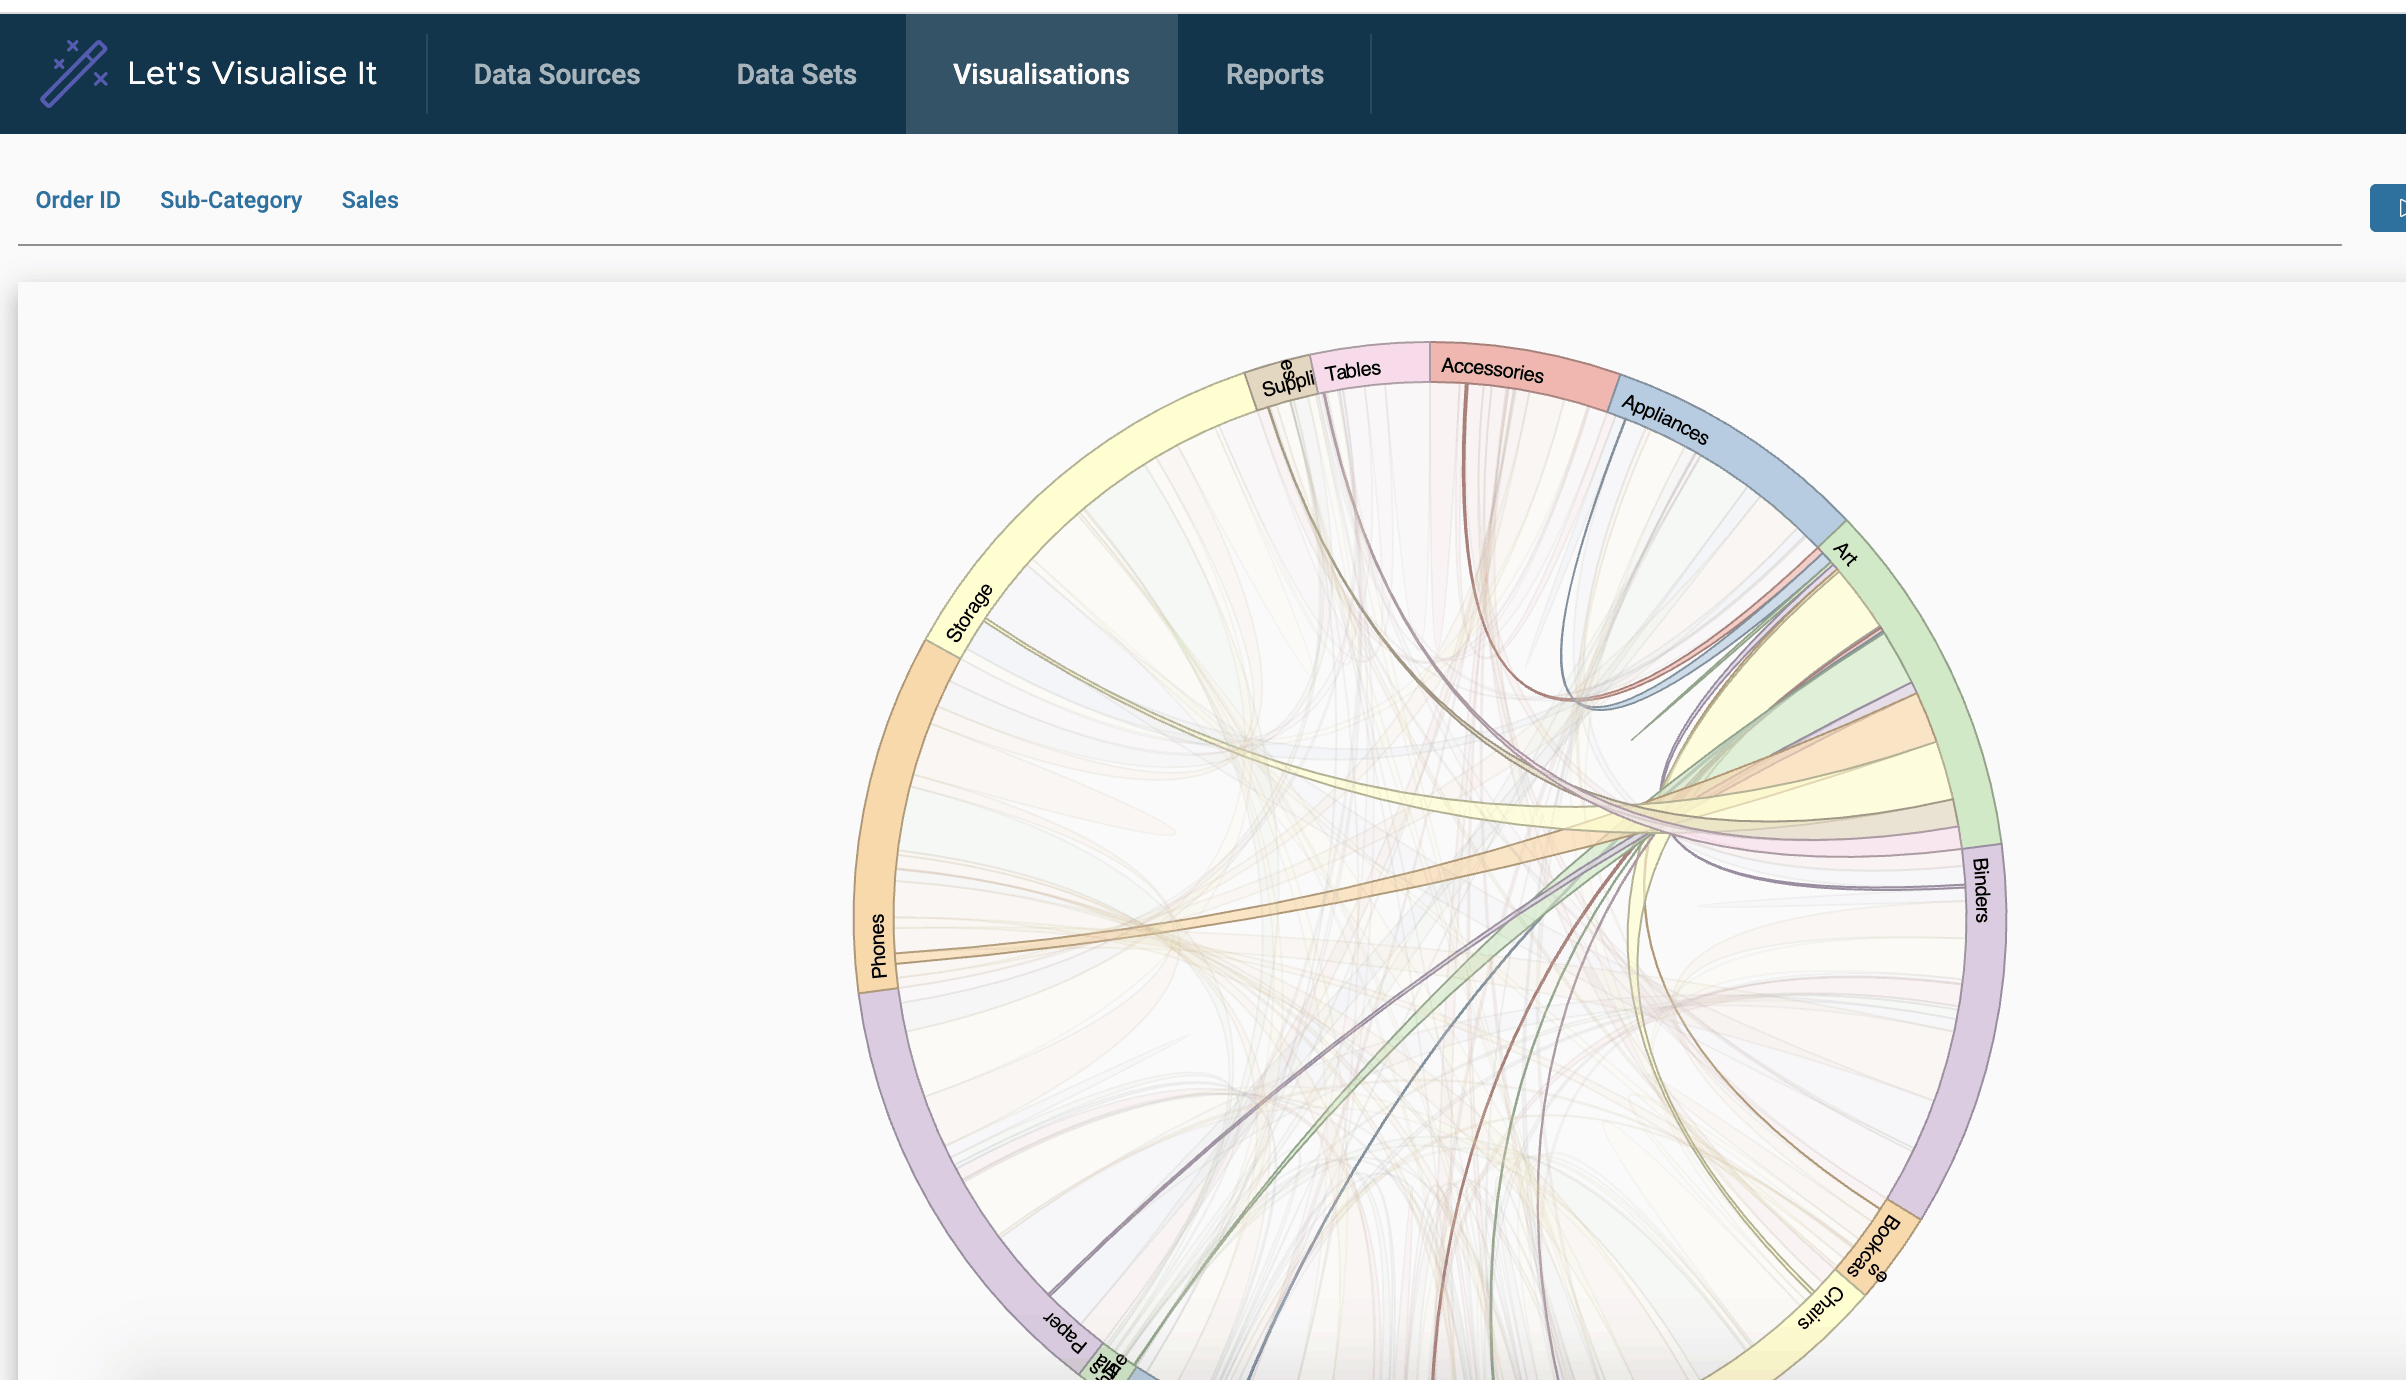
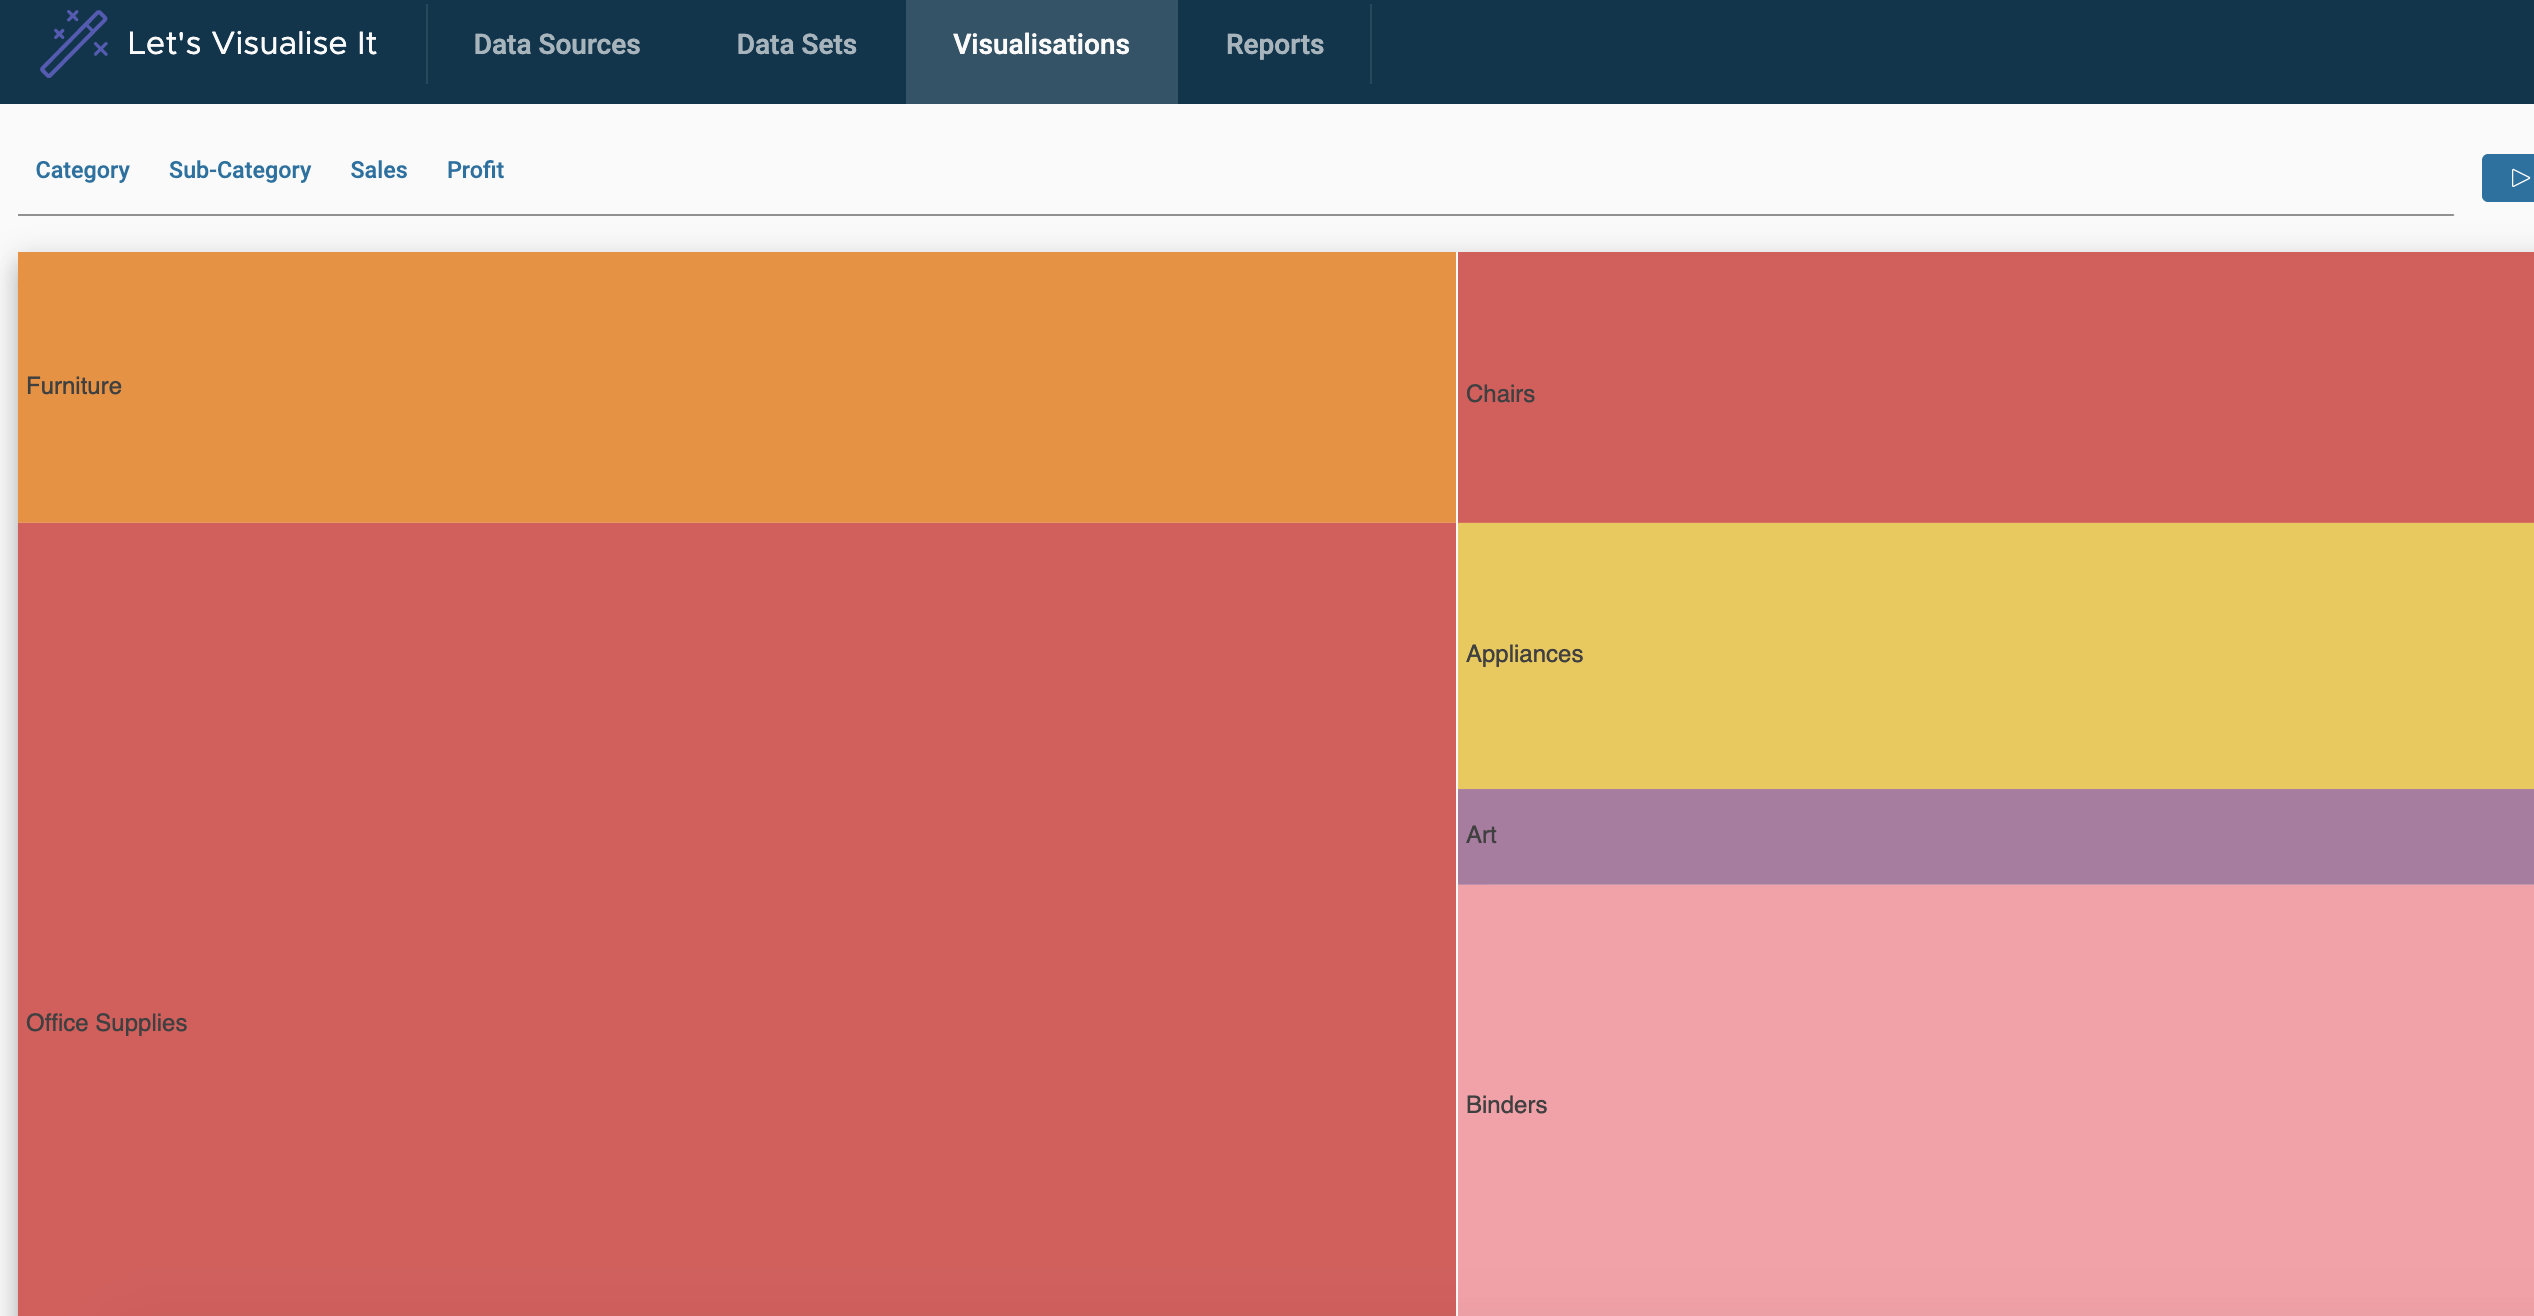
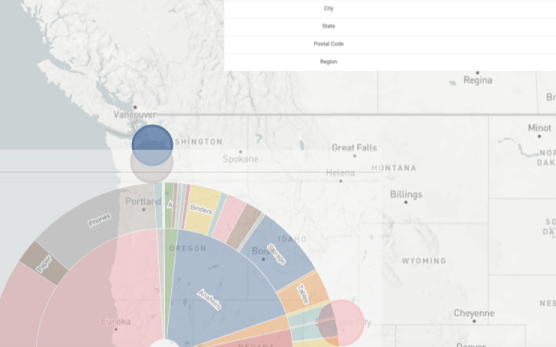
Use 10s of visualisations to slice and dice as required.
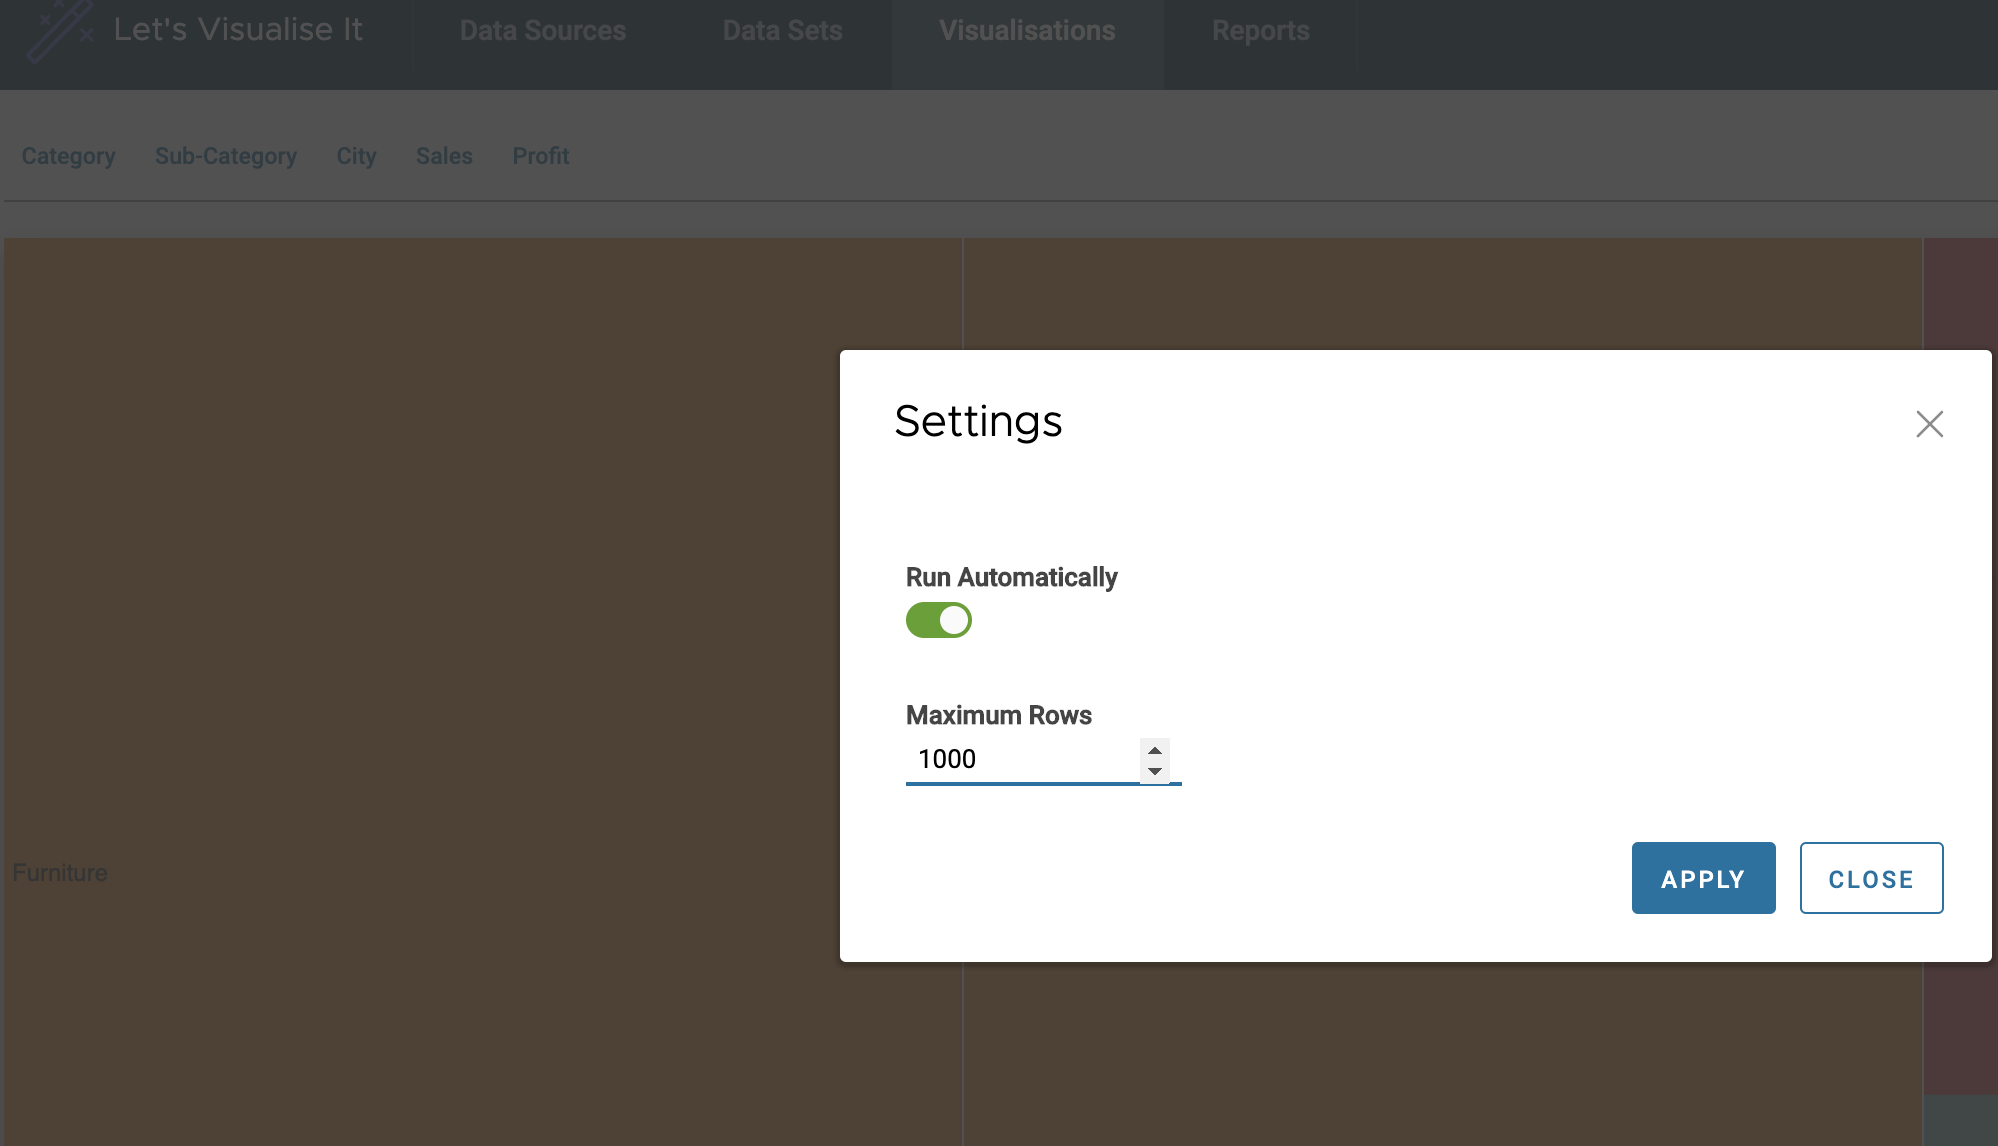
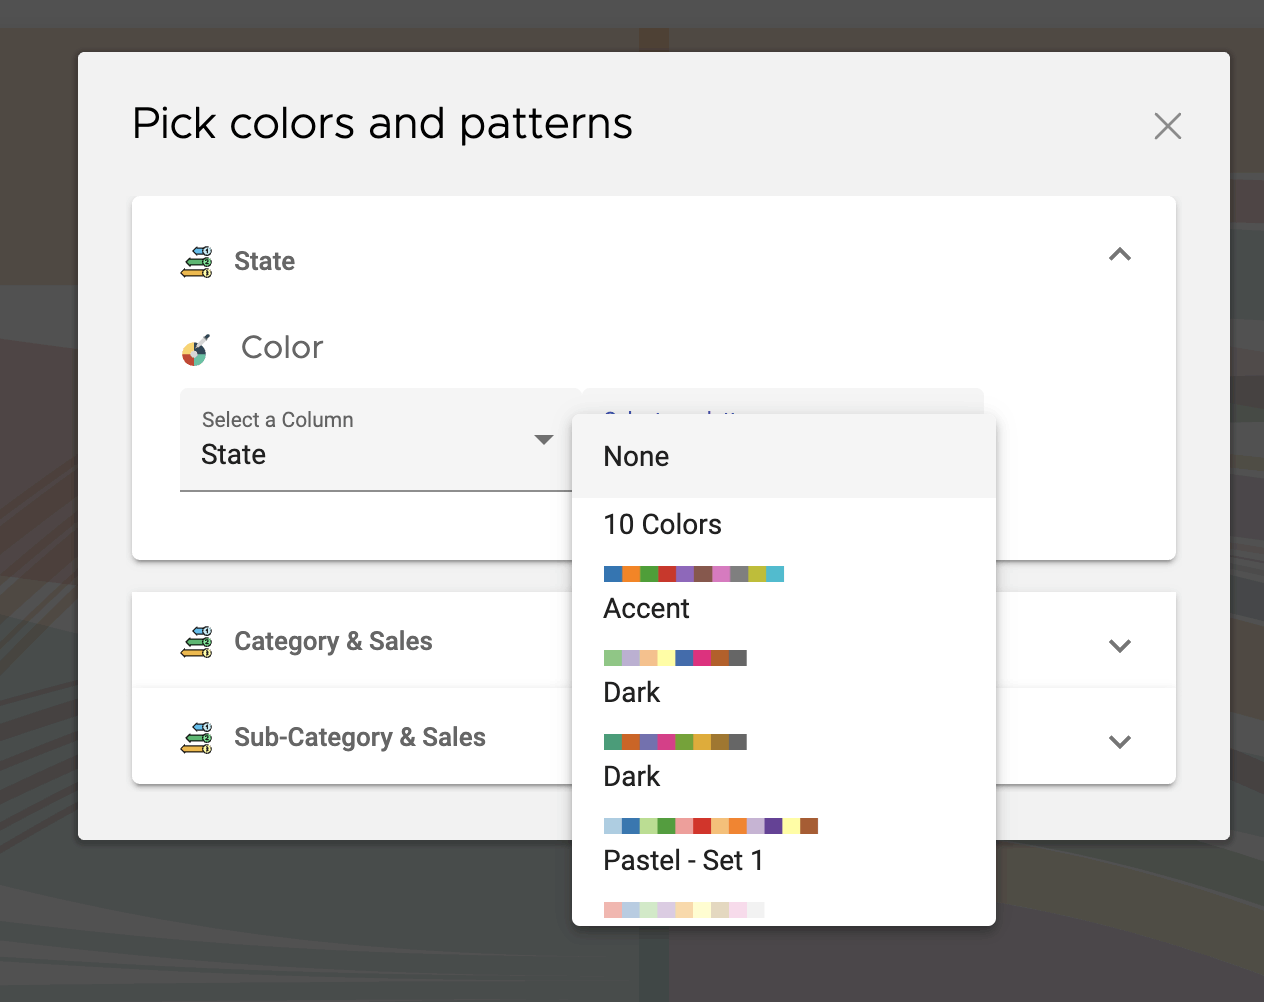
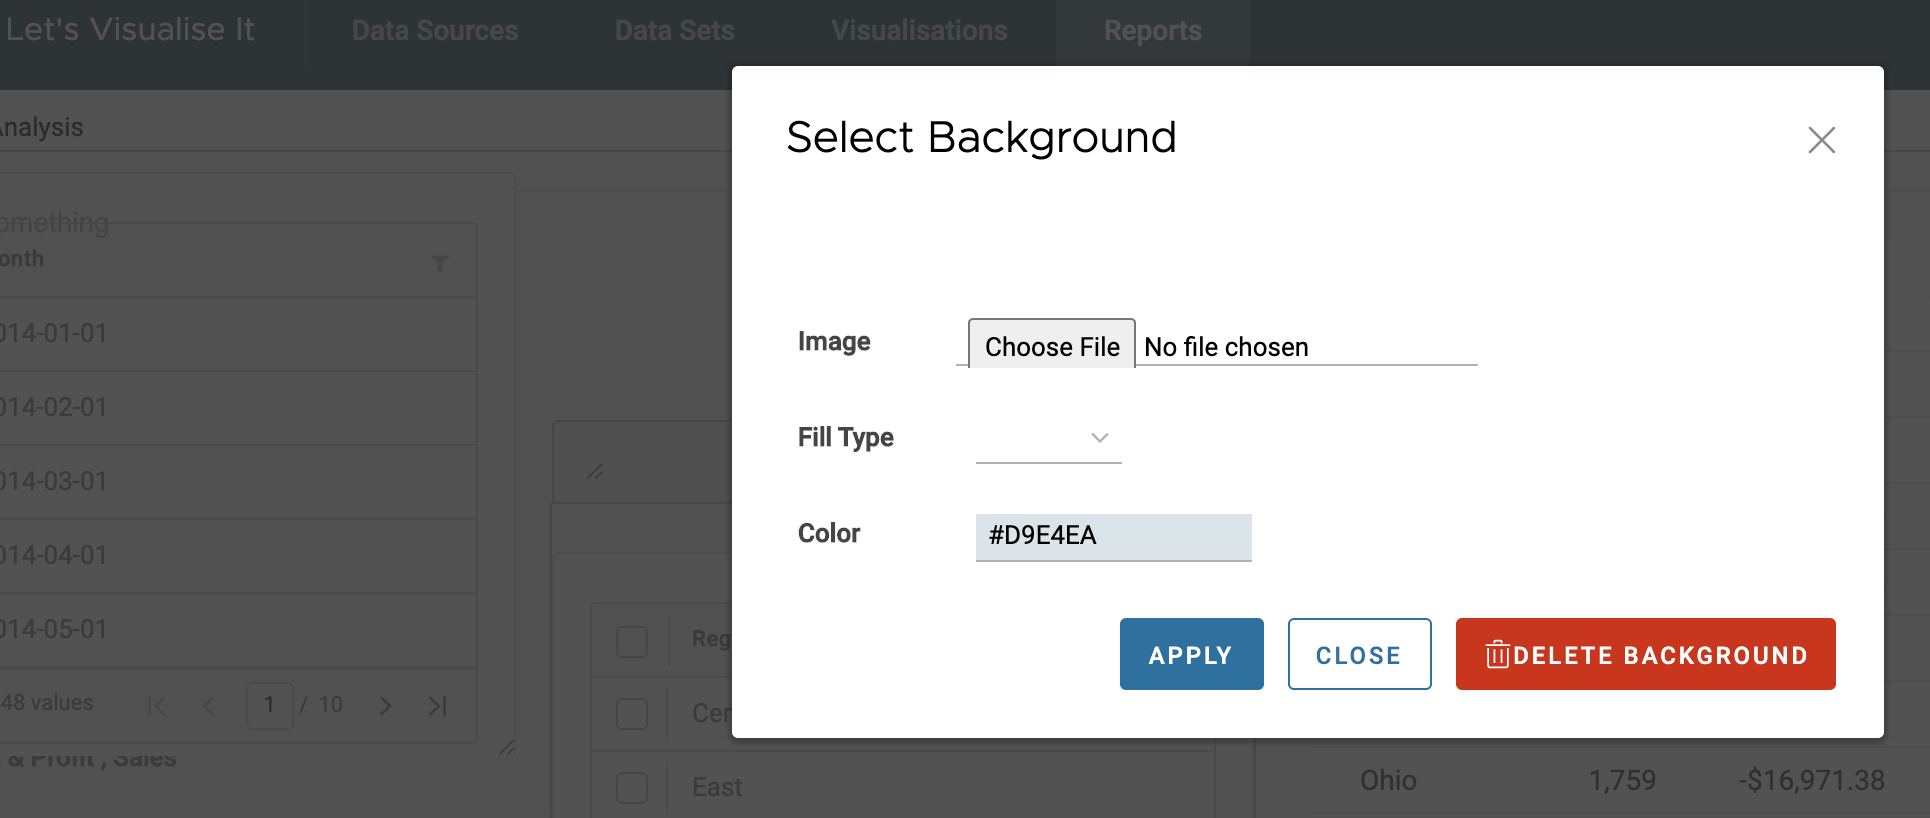
Each of these are fully customizable with colors, patterns, backgrounds and more.

Scalable, API Driven, Performant
Cloud Native, Kubernetes, Open API 2.0, Caching Engine
Built on Kubernetes with a distributed design to scale to as much or as little as you need.
Built to be fully compliant with Open Api 2.0, all actions can be triggered using an Auth Key
Caching Query Engine to deliver optimal results

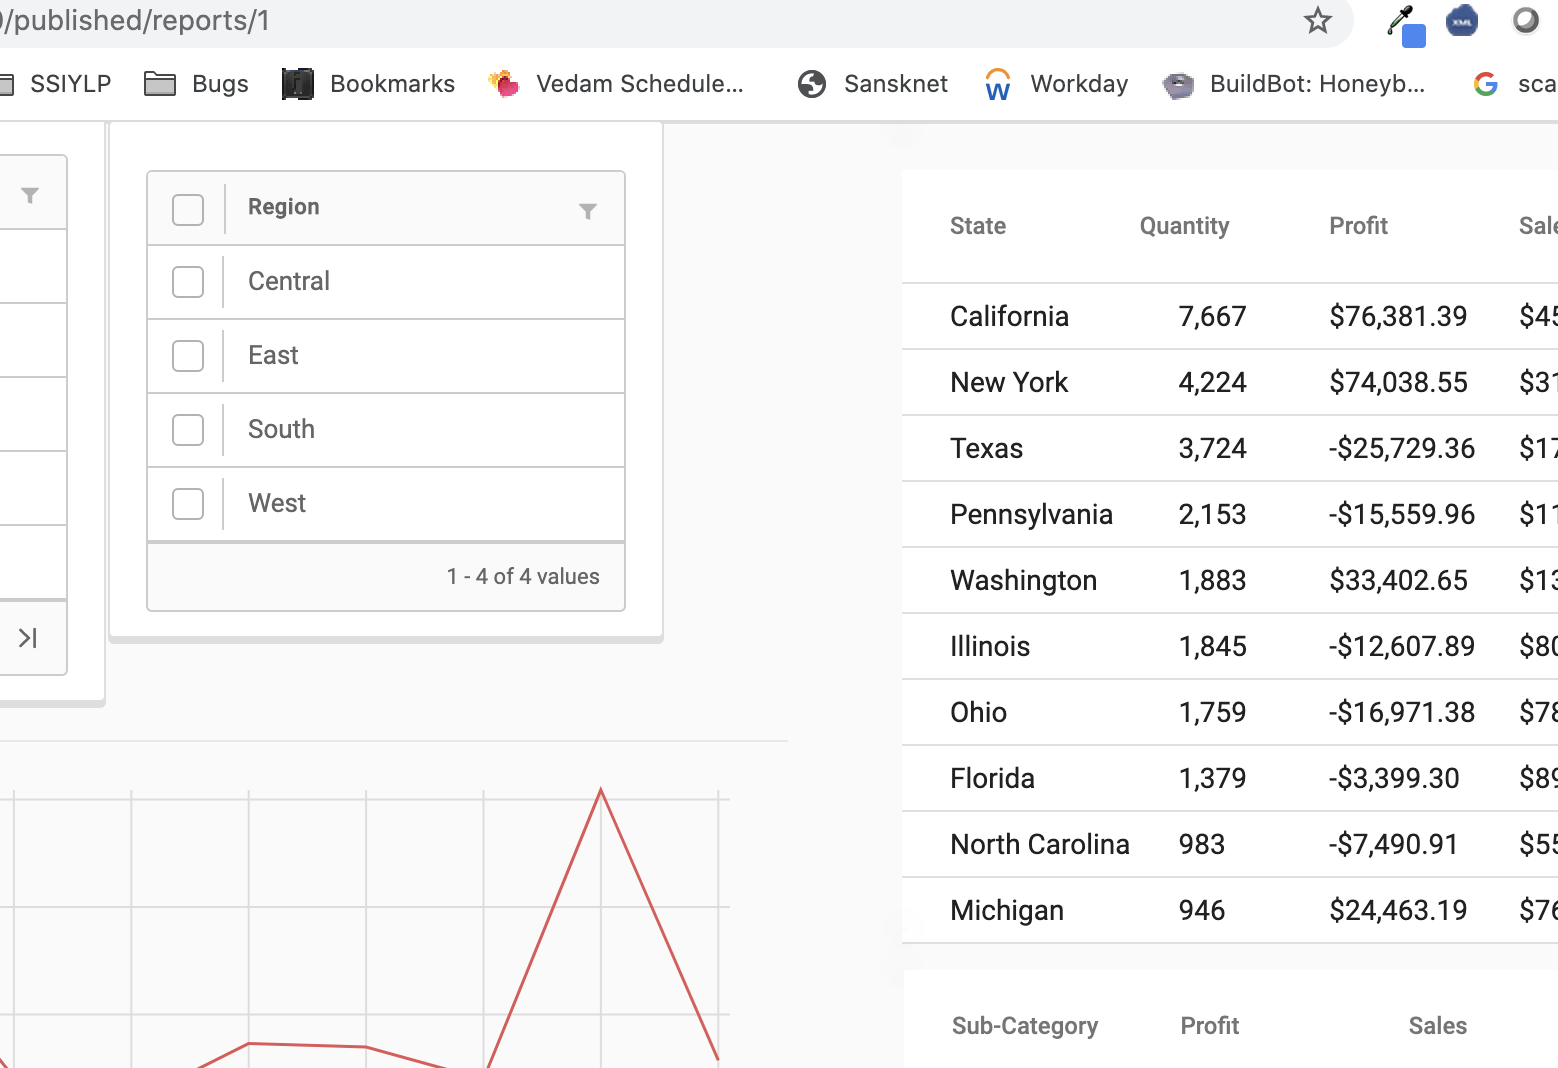
Published, Embeddable Reports
Web Components / Stand Alone Reports
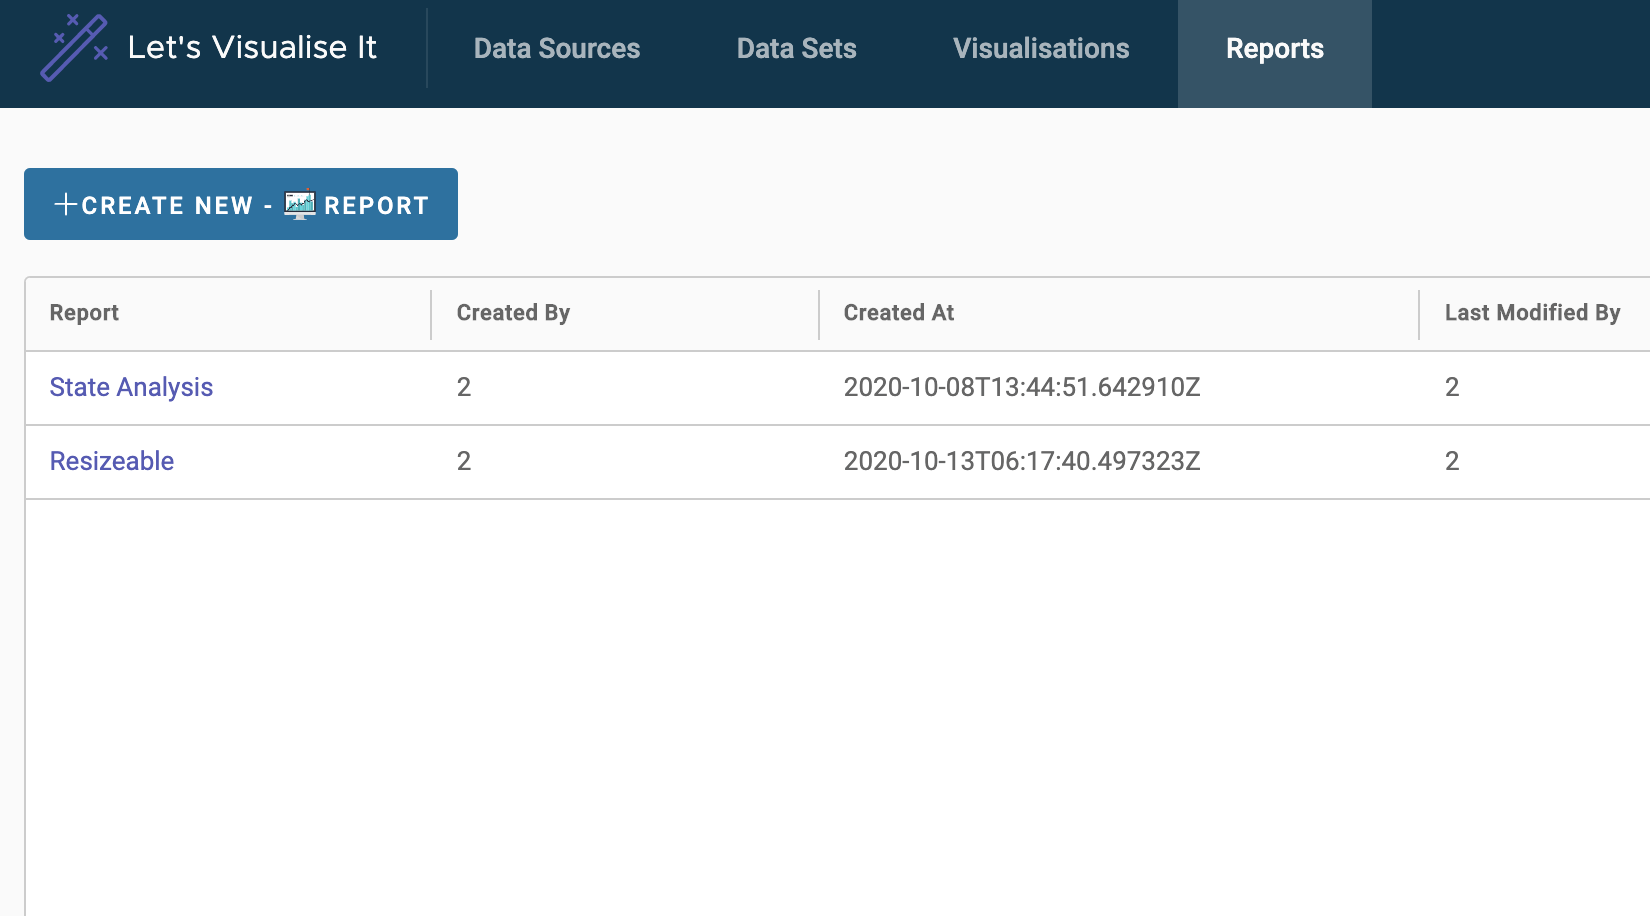
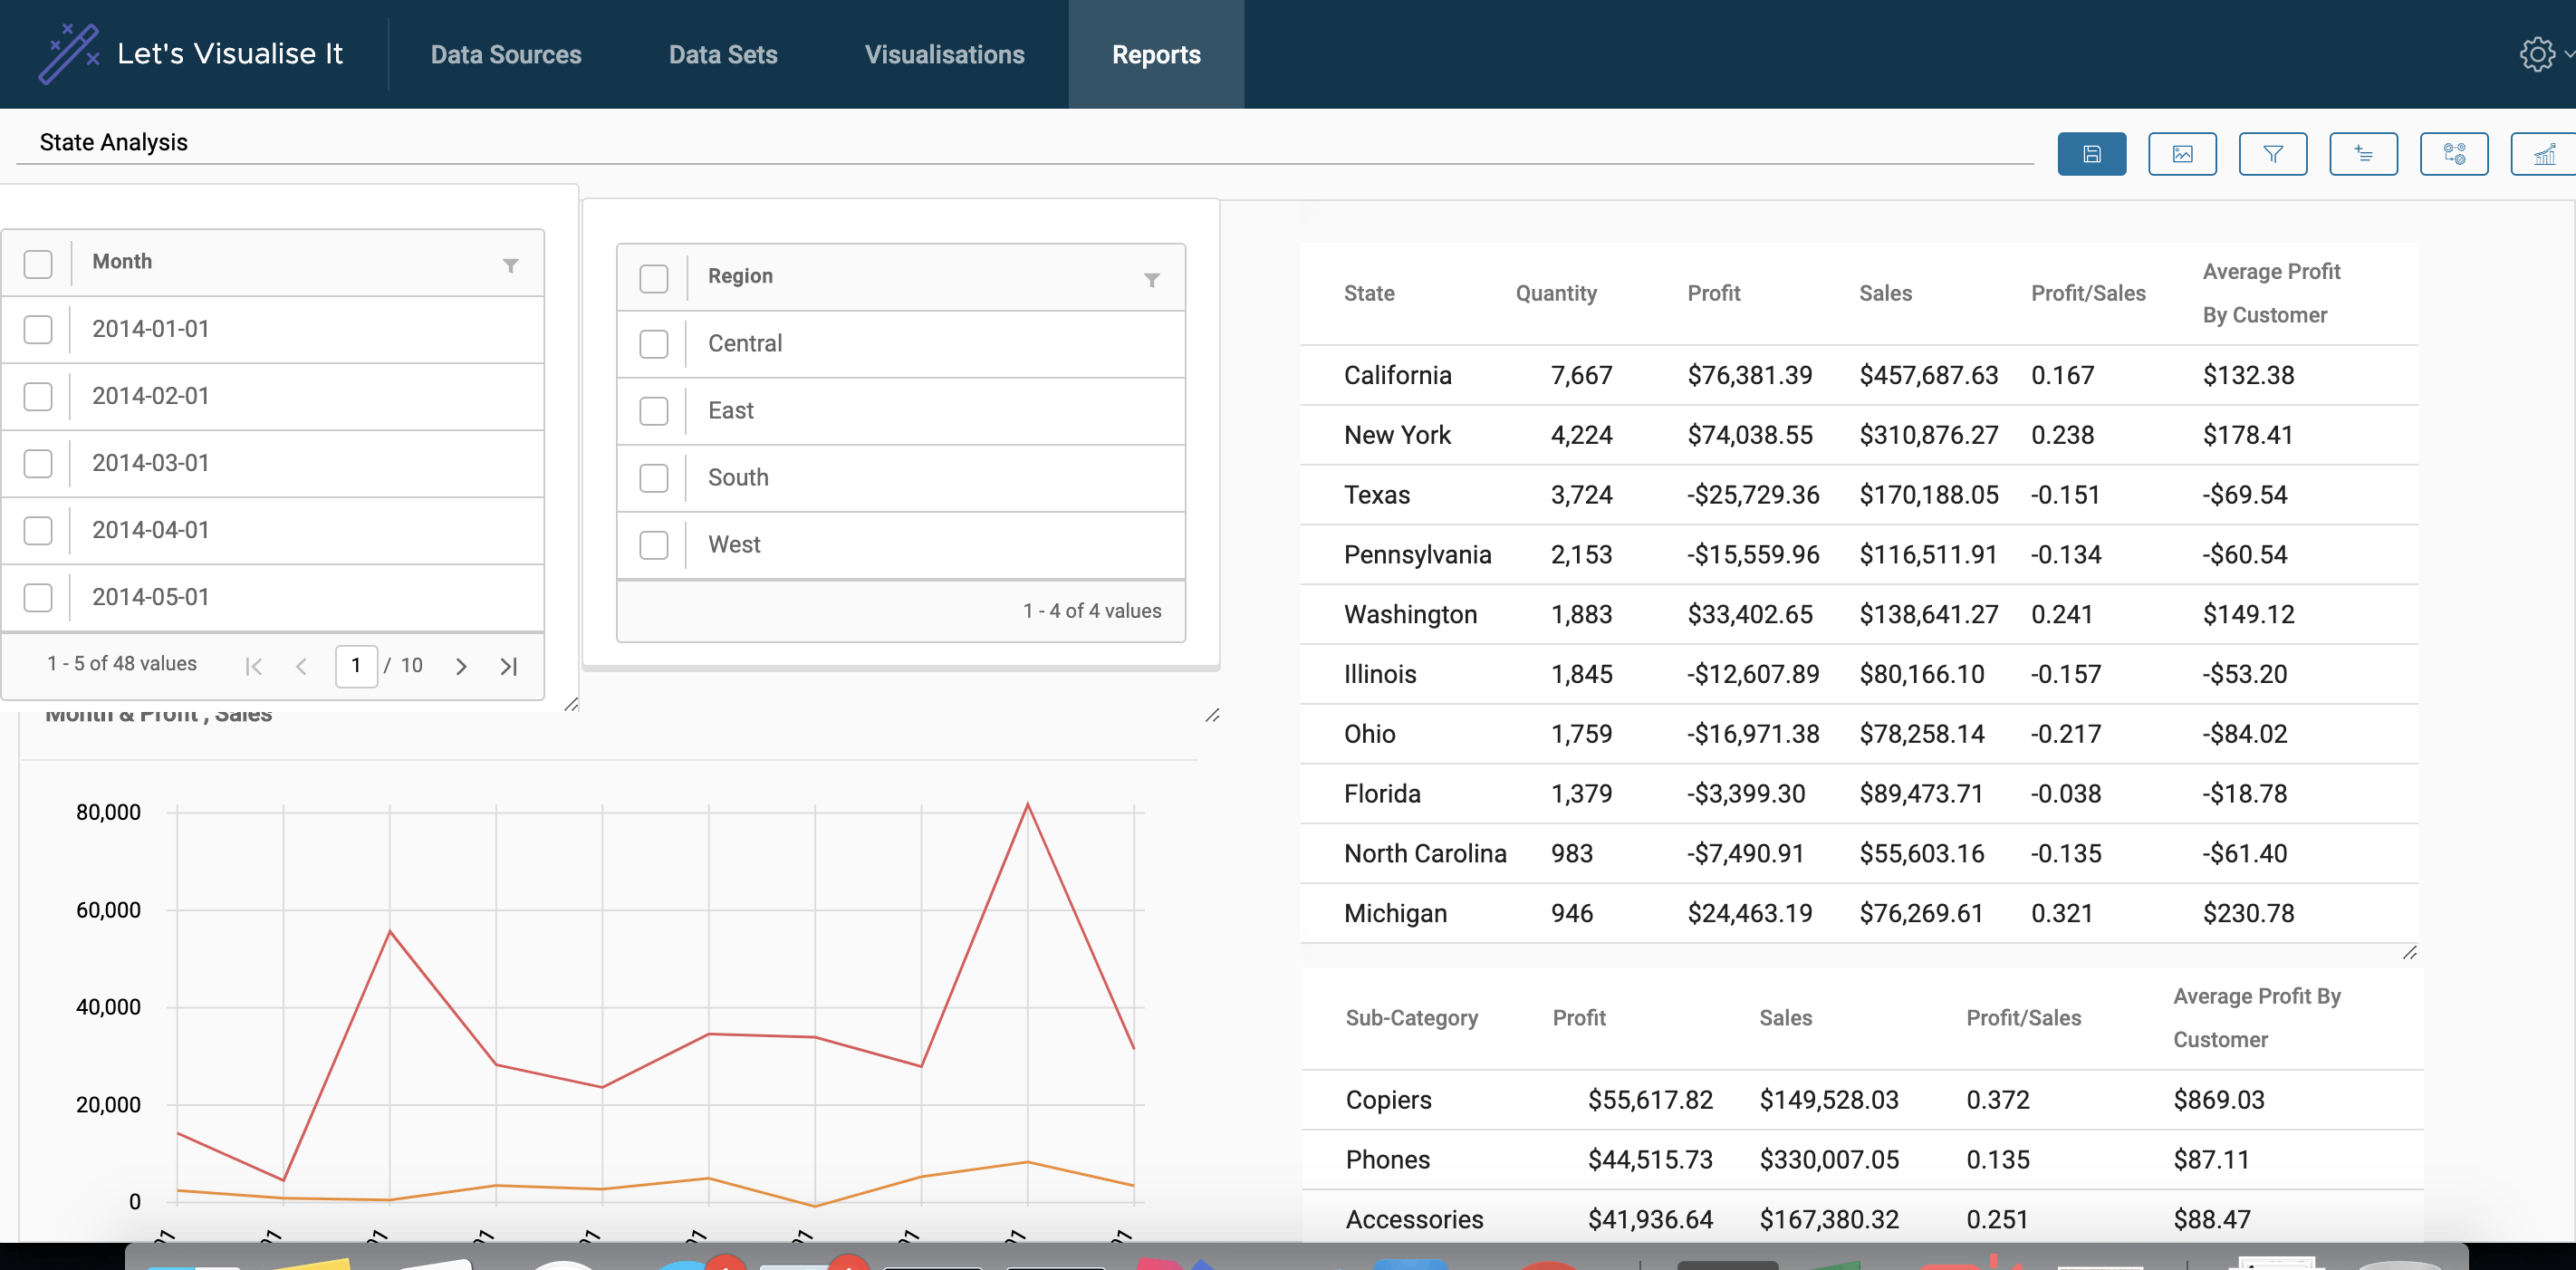
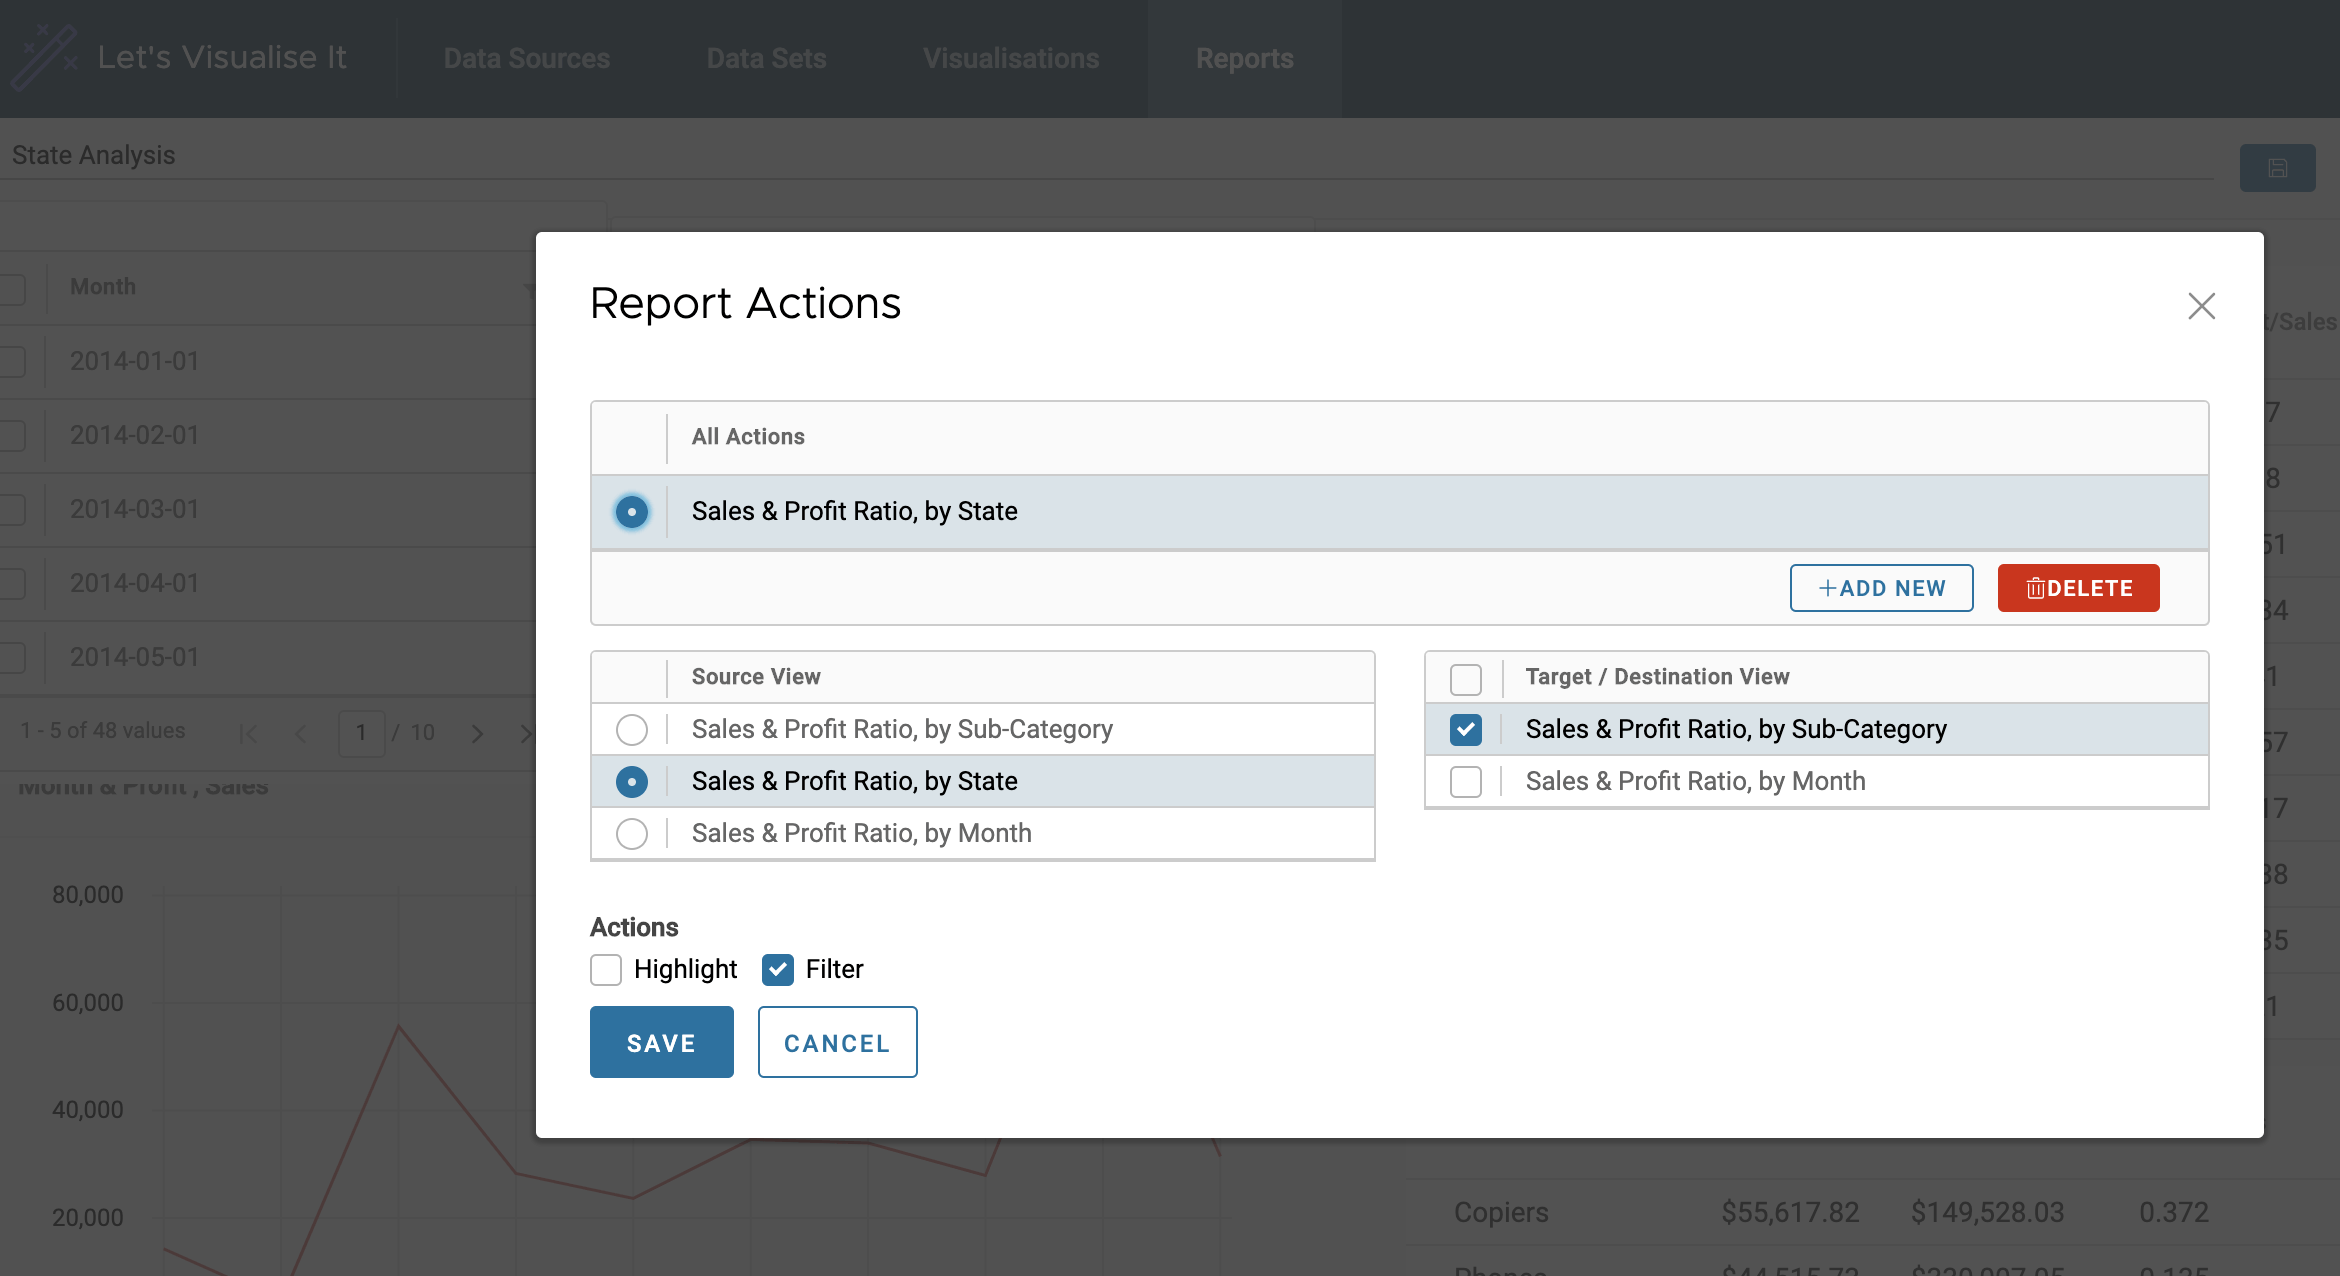
Fully customizable reports with multiple report actions.
Embed views within other tooltips to provide complete context to the user.
Either choose to embed a single visualisation or an entire report within your own HTML page. You can propagate events to and from the views.

